

T-staging of rectal cancer: accuracy of 3.0 Tesla MRI compared with 1.5 Tesla
- PMID: 21674192
- PMCID: PMC3345180
- DOI: 10.1007/s00261-011-9770-5
T-staging of rectal cancer: accuracy of 3.0 Tesla MRI compared with 1.5 Tesla
Abstract
Objectives: Magnetic resonance imaging (MRI) is not accurate in discriminating T1-2 from borderline T3 rectal tumors. Higher resolution on 3 Tesla-(3T)-MRI could improve diagnostic performance for T-staging. The aim of this study was to determine whether 3T-MRI compared with 1.5 Tesla-(1.5T)-MRI improves the accuracy for the discrimination between T1-2 and borderline T3 rectal tumors and to evaluate reproducibility.
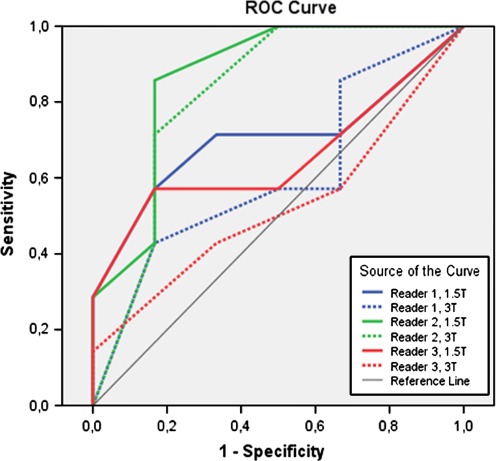
Methods: 13 patients with non-locally advanced rectal cancer underwent imaging with both 1.5T and 3T-MRI. Three readers with different expertise evaluated the images and predicted T-stage with a confidence level score. Receiver operator characteristics curves with areas under the curve (AUC) and diagnostic parameters were calculated. Inter- and intra-observer agreements were calculated with quadratic kappa-weighting. Histology was the reference standard.
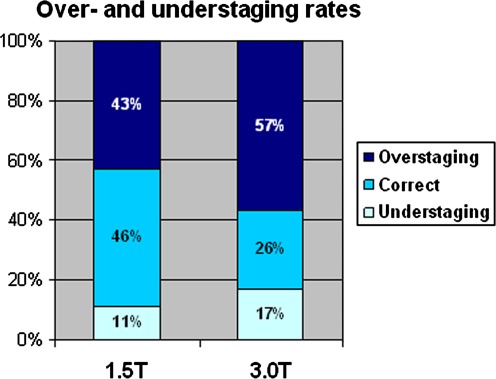
Results: Seven patients had pT1-2 tumors and six had pT3 tumors. AUCs ranged from 0.66 to 0.87 at 1.5T vs. 0.52-0.82 at 3T. Mean overstaging rate was 43% at 1.5T and 57% at 3T (P = 0.23). Inter-observer agreement was κ 0.50-0.71 at 1.5T vs. 0.15-0.68 at 3T. Intra-observer agreement was κ 0.71 at 1.5T and 0.76 at 3T.
Conclusions: This is the first study to compare 3T with 1.5T MRI for T-staging of rectal cancer within the same patients. Our results showed no difference between 3T and 1.5T-MRI for the distinction between T1-2 and borderline T3 tumors, regardless of expertise. The higher resolution at 3T-MRI did not aid in the distinction between desmoplasia in T1-2-tumors and tumor stranding in T3-tumors. Larger studies are needed to acknowledge these findings.
Figures

References
-
- Vogl TJ, Pegios W, Mack MG, et al. Accuracy of staging rectal tumors with contrast-enhanced transrectal MR imaging. AJR Am J Roentgenol. 1997;168(6):1427–1434. - PubMed
-
- Slater A, Halligan S, Taylor SA, Marshall M. Distance between the rectal wall and mesorectal fascia measured by MRI: effect of rectal distension and implications for preoperative prediction of a tumor-free circumferential resection margin. Clin Radiol. 2006;61(1):65–70. doi: 10.1016/j.crad.2005.08.010. - DOI - PubMed
Publication types
MeSH terms
LinkOut - more resources
Full Text Sources
Medical
