. 2011 Aug;224(4):540-52.
doi: 10.1002/path.2891. Epub 2011 Jun 14.

Rpl27a mutation in the sooty foot ataxia mouse phenocopies high p53 mouse models

Affiliations

Rpl27a mutation in the sooty foot ataxia mouse phenocopies high p53 mouse models

Tamara Terzian et al. J Pathol. 2011 Aug.

Abstract

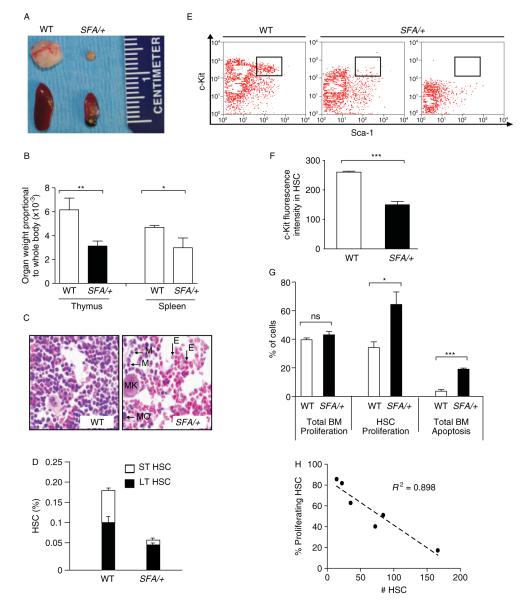
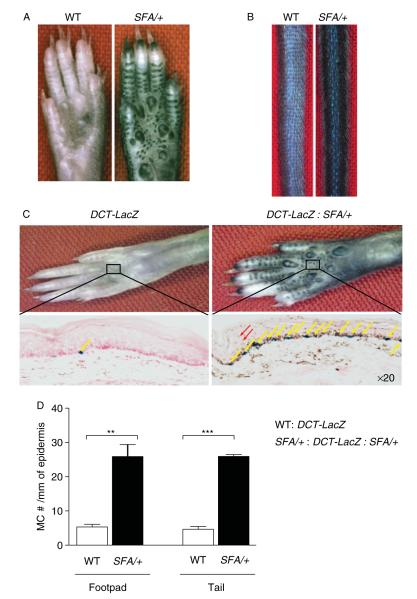
Ribosomal stress is an important, yet poorly understood, mechanism that results in activation of the p53 tumour suppressor. We present a mutation in the ribosomal protein Rpl27a gene (sooty foot ataxia mice), isolated through a sensitized N-ethyl-N-nitrosourea (ENU) mutagenesis screen for p53 pathway defects, that shares striking phenotypic similarities with high p53 mouse models, including cerebellar ataxia, pancytopenia and epidermal hyperpigmentation. This phenocopy is rescued in a haploinsufficient p53 background. A detailed examination of the bone marrow in these mice identified reduced numbers of haematopoietic stem cells and a p53-dependent c-Kit down-regulation. These studies suggest that reduced Rpl27a increases p53 activity in vivo, further evident with a delay in tumorigenesis in mutant mice. Taken together, these data demonstrate that Rpl27a plays a crucial role in multiple tissues and that disruption of this ribosomal protein affects both development and transformation.


Figures

Figure 1
Figure 1
Meiotic mapping and identification of the mutation responsible for the SFA phenotype. (A) Meiotic mapping of the SFA locus performed after a two-generation backcross onto the 129S6/SvEv background from the C57BL/6J parent strain. C57BL/6J genotypes are represented by black boxes and 129S6/SvEv by white boxes. Polymorphic microsatellite marker designation is shown on the left, while physical location is shown on the right of the box genotype diagram. Numbers of both SFA/+ and WT mice of each genotype combination for the nine microsatellite markers are shown underneath the box genotype diagram. (B) The first two panels are sequence chromatograms of mice of indicated genotypes. The bottom panel represents the intron–exon structure of the Rpl27a gene. The white boxes illustrate the untranslated exons and the red boxes illustrate the coding exons. The ENU-induced point mutation (IVS4 -15A > G) within the intron four-splice acceptor is represented by a red star. (C) Expression levels of Rpl27a (mean + SEM) in SFA/+ P3 cerebellum (n = 8, p = 0.0388), P23-25 BM (n = 6, p = 0.0426) and P3 footpad skin (n = 9, p = 0.0283) in comparison to levels in WT tissue indicated by the dotted line (set at 1; n = 6 for cerebellum, n = 7 for BM and n = 5 for skin). (d) Variably penetrant low body weight and size in P35 SFA/+ mice. (E) Postnatal growth and survival curves of WT and SFA/+ mice.
Figure 2
Figure 2
Blood phenotype in SFA/+ mice. (A). A representative picture of thymi and spleens from a severely affected SFA/+ and WT littermate (B) Histogram (mean + SEM, n = 3) of thymus and spleen weights relative to whole body weights in WT and SFA/+ littermates. p = *0.0079 and p = **0.001. (C) H&tE stain of sections from upper femurs of P21-P23 WT and SFA/+ littermates, showing BM with all subtypes of blood cells present, such as megakaryocyte (MK), macrophage (MO), myeloid (M) and erythroid (E) cells. (D) Histogram presenting flow cytometry analysis of short-term (ST) and long-term (LT) HSC numbers (mean + SEM) in flushed BM of P21-P23 mice (n = 6 for WT; n = 10 for severely affected SFA/+), measured by Lin−/lo c-Kit+ Sca-1+ gated cells, which are sorted into Flk-2+ (LT) and FLK-2 (ST). p = 0.0114 for LT and p = 0.001 for ST. (E) Representative flow cytometric analysis of HSCs from flushed BM of P21-P23 WT and severely affected SFA/+ mice. Lin−/lo cells were gated on c-Kit and Sca-1. Small quadrant (R3) represents Sca-1+ c-Kit+ cells which contain the stem cells population. The second panel is representative of staining from most of the affected SFA/+ mice. The third panel shows staining from one of the most affected mice. (F) Quantitation of fluorescence intensity of c-Kit+ cells (mean + SEM) in the R3 HSC quadrant of (E) (n = 6 mice/genotype). ***p < 0.0001. (G) Total BM and HSCs (%) undergoing proliferation (BrdU+ cells) [n = 6/genotype; p = 0.3130 (ns) and *0.0136], and total BM cells (%) undergoing apoptosis (annexin V staining, n = 3/genotype; ***p = 0.0001) measured by flow cytometry (mean + SEM) in WT andseverely affected SFA/+ mice. (H) The relationship between HSC numbers in whole BM and percentage proliferating HSCs (BrdU+ cells) is plotted. A ‘best-fit’ straight dotted line is drawn through the data (linear regression). R2 = square of correlation coefficient.
Figure 3
Figure 3
Hyperpigmentation in SFA/+ mice. (A) Hyperpigmentation of adult WT footpads in comparison to age-matched SFA/+ mice. (B) Hyperpigmentation of WT and SFA/+ tails. (C) DCT–LacZ transgenic mouse enables specific identification of melanocytes by β-galactosidase staining (stained in blue). Top panels represent footpads of indicated genotypes. Bottom panels represent β-galactosidase staining of the above corresponding panel. Blue melanocytes are indicated by yellow arrows. The red arrow points to representative melanin granules in SFA/+ skin. (D) Melanocyte counts/10 mm of linear epidermis [visualized by the blue LacZ-stained cells in (C)] in WT and SFA/+ footpads and tails (n = 3/genotype/tissue). p = **0.0024 and ***p < 0.0001.
Figure 4
Figure 4
Cerebellar ataxia in SFA/+ mice. (A) Nissl stains of mid-sagittal sections of WT and SFA/+ adult (P56) cerebellum. (B) Calbindin-1D28K IF staining of the Purkinje cells. Disorganization of Purkinje neurons found ectopically located throughout the cerebellum of P56 SFA/+ mouse. M, molecular layer showing staining of Purkinje dendrites; P, Purkinje cell bodies; G, granule layer. (C) Top panel, proliferation measured by BrdU (green)/PI (red) IF on mid-sagittal sections of P3 cerebellums; white line delineates the granule layer; bottom panel, apoptosis assayed by caspase-3 IHC staining; apoptotic cells are indicated by black arrows. (D) Quantitation of % BrdU+ cells/field of P3 WT and SFA/+ cerebellums (n = 3/genotype). *p = 0.0315.
Figure 5
Figure 5
Low Rpl27a mouse phenocopies high p53 mouse models. (A) H&tE of femur showing the BM in P15 WT, severely affected SFA/+ and Mdm2+/−:Mdm4+/− mouse (high p53). (B) H&tE of cerebellum in WT, severely affected SFA/+ and Mdm2+/−:Mdm4+/− mice. (C) Footpads from adult mice of p53 pathway models. *Mdm4-null allele with deletion of exon 2. $Mdm4-null allele with deletion of part of introns 2–5.
Figure 6
Figure 6
Genetic interaction between Rpl27a and p53 and impact of low Rpl27a on survival. (A) Motor coordination ranges of mice of designated genotypes, measured by the rotarod assay. Latency to fall on the final rotarod trial for each 10 week-old mouse is plotted versus the weight of the mouse. Boxes designate the ranges for weight and scores/genotype. (B) The impact of different p53 genotypes on pigmentation of SFA/+ footpads. (C) Kaplan–Meier survival curve (Log-rank test, p = 0.001) between p53+/−:SFA/ and p53+/− curves.
Figure 7
Figure 7
p53 pathway signalling in P3 SFA/+ cerebellums. (A) Detection of p53 immunopositivity in mid-sagittal SFA/+ cerebellum by IHC. (B) ISH of p53, its negative regulators Mdm2 and Mdm4, and target gene Cdkn1a on WT and SFA/+ cerebellum. (C) Histogram expression of fold expression of indicated genes (mean + SEM, n = 6/genotype) in SFA/+ cerebellums, measured in triplicate in comparison to levels in WT cerebellums (indicated by the dotted line that is set at 1). p = 0.017 (p53); p = 0.0240 (Mdm2); p = 0.0002 (Cdkn1a); and p = 0.0168 (Puma).

References

    1. Marechal V, Elenbaas B, Piette J, et al. The ribosomal L5 protein is associated with mdm-2 and mdm-2–p53 complexes. Mol Cell Biol. 1994;14:7414–7420. - PMC - PubMed
    1. Walker G, Box N. Ribosomal stress, p53 activation and the tanning response. Exp Rev Dermatol. 2008;3:649–656. - PMC - PubMed
    1. Chen D, Zhang Z, Li M, et al. Ribosomal protein S7 as a novel modulator of p53-MDM2 interaction: binding to MDM2, stabilization of p53 protein, and activation of p53 function. Oncogene. 2007;26:5029–5037. - PubMed
    1. Yadavilli S, Mayo LD, Higgins M, et al. Ribosomal protein S3: a multi-functional protein that interacts with both p53 and MDM2 through its KH domain. DNA Repair (Amst) 2009;8:1215–1224. - PMC - PubMed
    1. Zhang Y, Wolf GW, Bhat K, et al. Ribosomal protein L11 negatively regulates oncoprotein MDM2 and mediates a p53-dependent ribosomal-stress checkpoint pathway. Mol Cell Biol. 2003;23:8902–8912. - PMC - PubMed

Publication types

MeSH terms