. 2011 Sep;70(3):362-73.
doi: 10.1002/ana.22449. Epub 2011 Jun 14.

Japanese macaque encephalomyelitis: a spontaneous multiple sclerosis-like disease in a nonhuman primate

Affiliations

Japanese macaque encephalomyelitis: a spontaneous multiple sclerosis-like disease in a nonhuman primate

Michael K Axthelm et al. Ann Neurol. 2011 Sep.

Abstract

Objective: To describe Japanese macaque encephalomyelitis (JME), a spontaneous inflammatory demyelinating disease occurring in the Oregon National Primate Research Center's (ONPRC) colony of Japanese macaques (JMs, Macaca fuscata).

Methods: JMs with neurologic impairment were removed from the colony, evaluated, and treated with supportive care. Animals were humanely euthanized and their central nervous systems (CNSs) were examined.

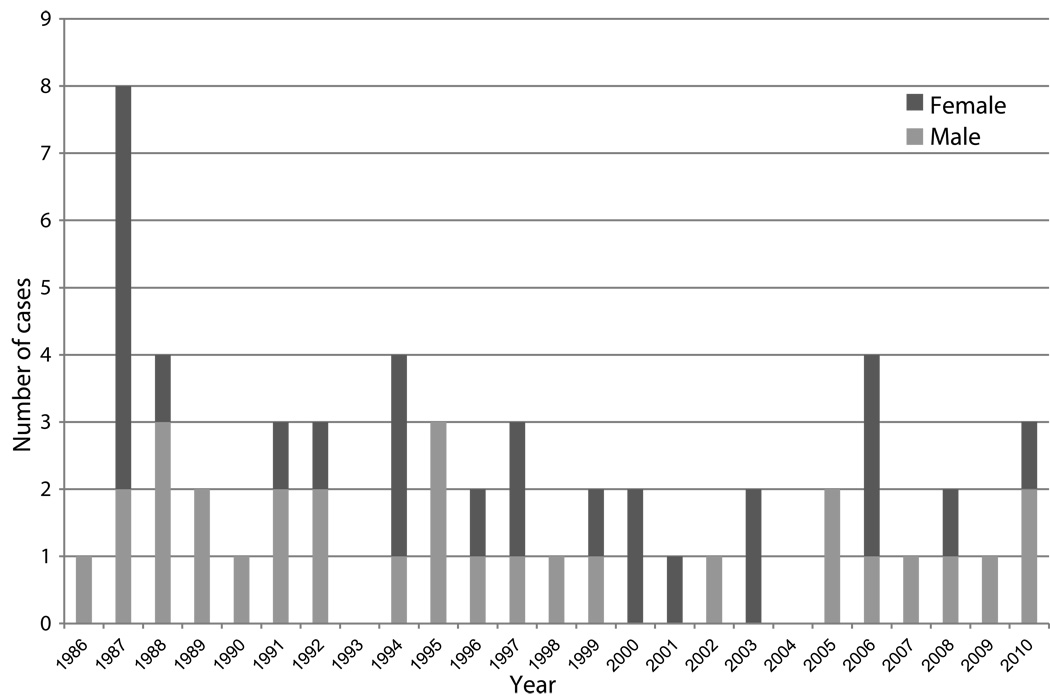
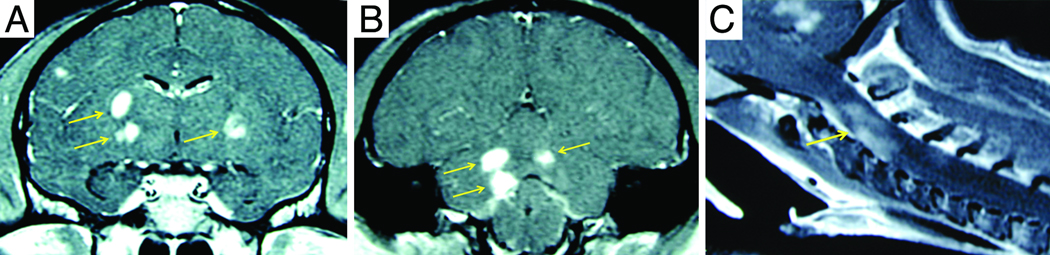
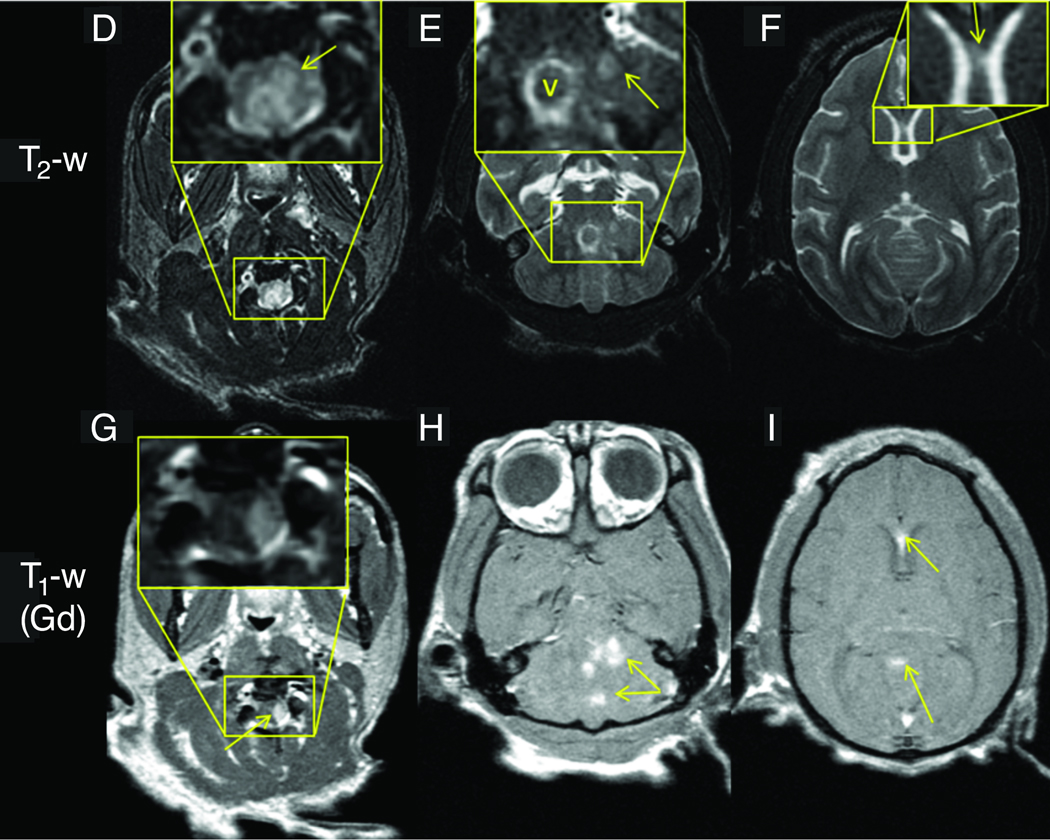
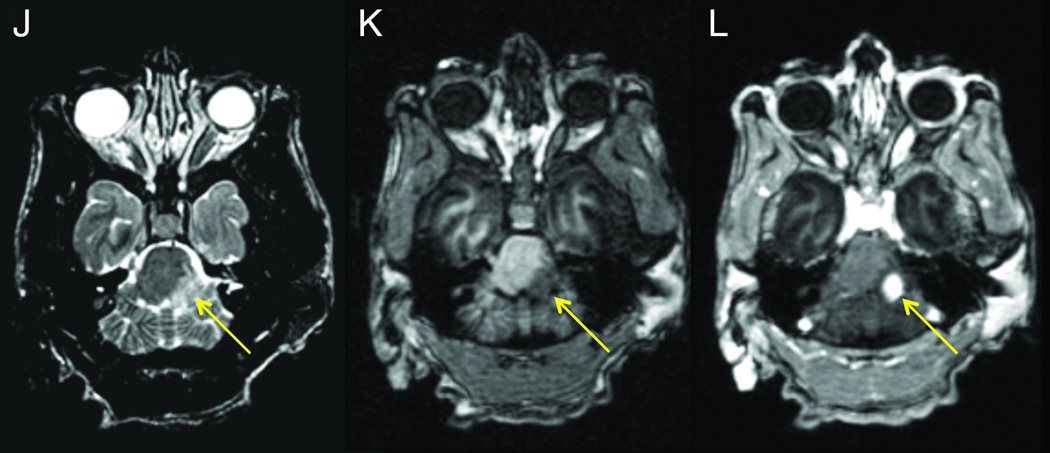
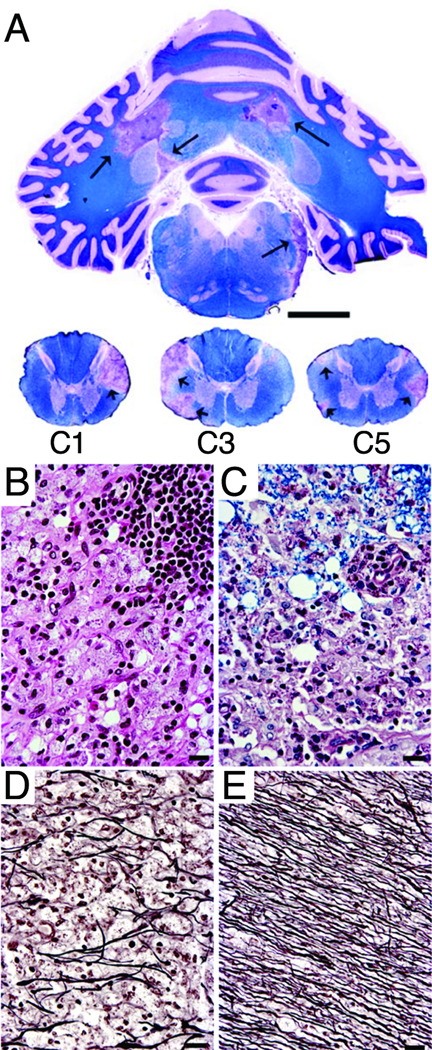
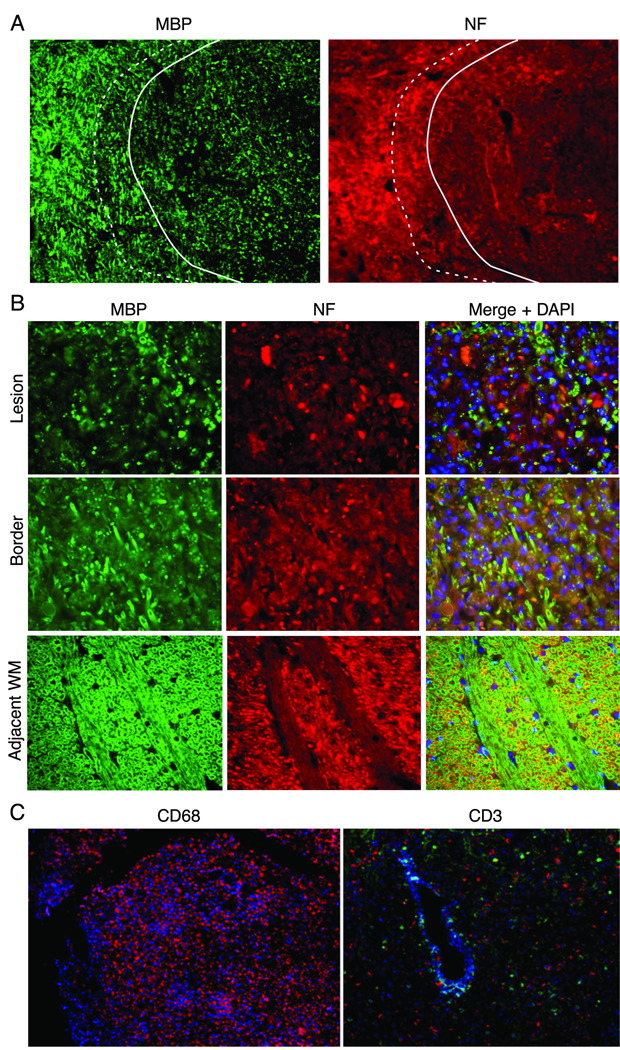
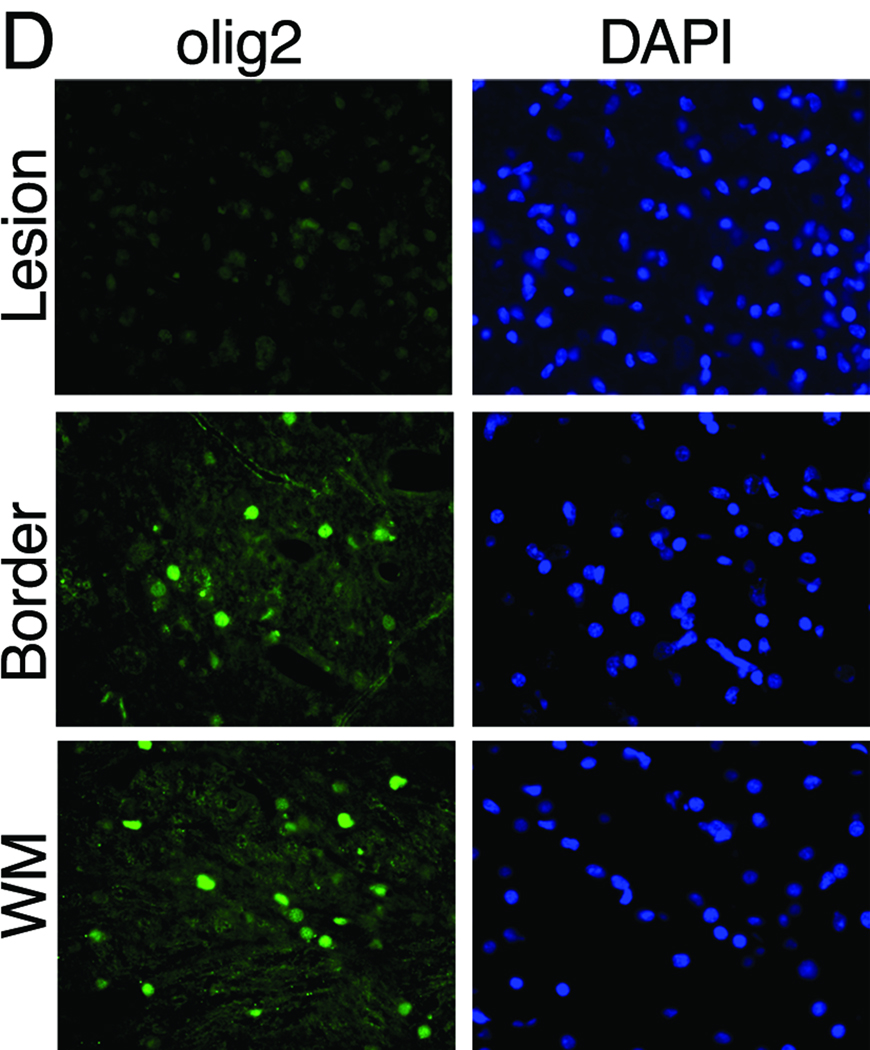
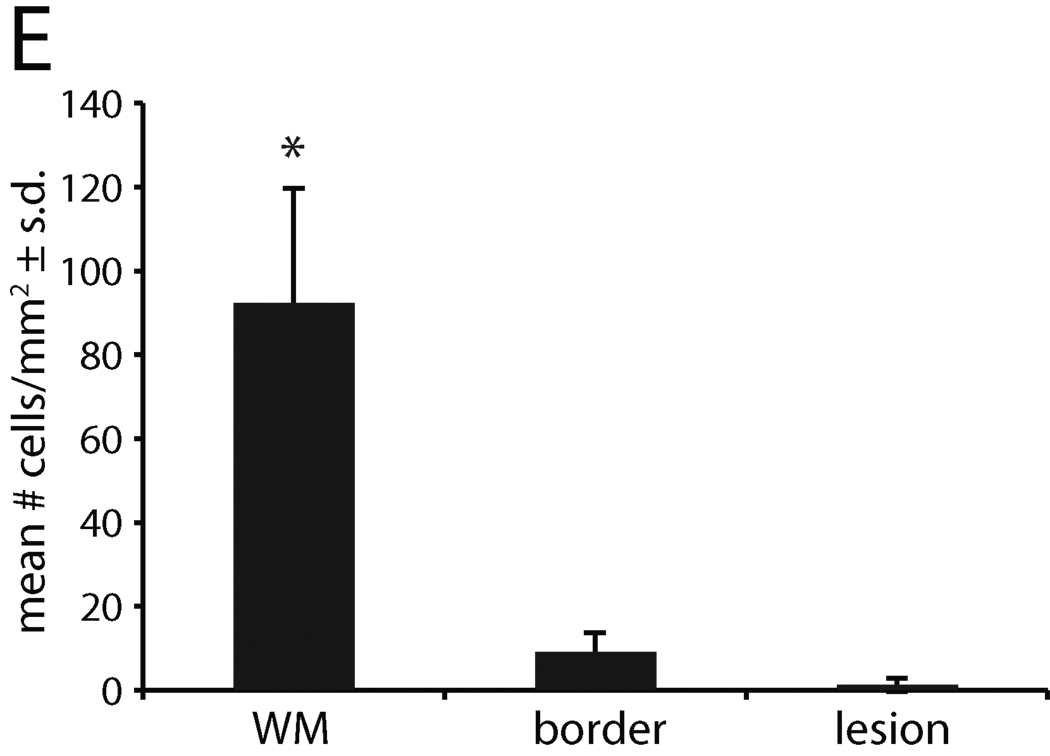
Results: ONPRC's JM colony was established in 1965 and no cases of JME occurred until 1986. Since 1986, 57 JMs spontaneously developed a disease characterized clinically by paresis of 1 or more limbs, ataxia, or ocular motor paresis. Most animals were humanely euthanized during their initial episode. Three recovered, later relapsed, and were then euthanized. There was no gender predilection and the median age for disease was 4 years. Magnetic resonance imaging of 8 cases of JME revealed multiple gadolinium-enhancing T(1) -weighted hyperintensities in the white matter of the cerebral hemispheres, brainstem, cerebellum, and cervical spinal cord. The CNS of monkeys with JME contained multifocal plaque-like demyelinated lesions of varying ages, including acute and chronic, active demyelinating lesions with macrophages and lymphocytic periventricular infiltrates, and chronic, inactive demyelinated lesions. A previously undescribed gamma-herpesvirus was cultured from acute JME white matter lesions. Cases of JME continue to affect 1% to 3% of the ONPRC colony per year.

Interpretation: JME is a unique spontaneous disease in a nonhuman primate that has similarities with multiple sclerosis (MS) and is associated with a novel simian herpesvirus. Elucidating the pathogenesis of JME may shed new light on MS and other human demyelinating diseases.


Figures

Figure 1
Figure 1
Number of Japanese macaques affected each year with Japanese macaque encephalomyelitis (JME).
Figure 2
Figure 2. MRI of animals with JME
Panels A–C, post-gadolinium T1-weighted MRI images from JM #19384 11 days after presentation with acute flaccid paralysis of the right pelvic limb. (A) Coronal image of cerebral hemispheres reveals gadolinium-enhanced lesions (arrows) in the internal capsule. (B) Coronal image of posterior cerebral hemispheres, cerebellum and brainstem shows 3 gadolinium-enhanced lesions in corpus medullare (arrows) of the cerebellum. (C) Sagittal image of upper cervical cord shows gadolinium-enhanced lesion (arrow). Panels D–I, axial 3Y MRI images from JM #26174 obtained 4 days after developing signs of JME. (D) Axial T2-weighed image of upper cervical spinal cord shows hyperintense signal that is expanded in insert and identified (arrow). (E) Hyperintense signal in cerebellar region that is expanded in insert and denoted (arrow). The hyperintense ring surrounding “v” in the insert is CSF fluid superior to the 4th ventricle adjacent to the superior medullary velum. (F) Hyperintense signal in the genu of the corpus callosum that is expanded in the insert and identified (arrow). Axial post-gadolinium T1-weighted image shows enhancing lesions in upper cervical spinal cord (G), cerebellum (H), and genu of the corpus callosum (I). Panels J–L, axial 3T MRI images from JM #13221 during the acute phase of JME. (J) Axial T2-weighted image shows hyperintense lesion in the left lateral pons and peduncule (arrow) that is hypointense on a T1-weighted pre-contrast MPRAGE (K, arrow) image. The lesion enhances on a T1-weighted MPRAGE image acquired 30 min after the administration of 0.2 mmol/kg gadoteridol (L, arrow.)
Figure 3
Figure 3. Histopathology of JME
Histopathological examination of the brain of JM #19384 obtained 53 days following clinical presentation of JME. (A) Luxol fast blue-PAS-hematoxylin stain of cerebellum and cervical spinal cord. Note the large, well-defined, irregular-shaped areas of myelin loss in the corpus medullare of the cerebellum (arrows) corresponding to the lesions seen 42 days earlier in the MRI images (Figure 2B). Similar lesions are present in the lateral white matter columns of the 1st, 2nd and 5th cervical spinal cord segments (arrows); the abnormalities in the upper cervical cord correspond to lesions seen on MRI (Figure 2C); scale bar, 1 cm. (B) High power magnification of a portion of the large chronic active plaque in the upper left of the cerebellum. Normal appearance of white matter is obliterated by large foamy macrophages and scattered lymphocytes. Swollen myelin sheaths appear as circular optically clear spaces. A portion of a thick perivascular lymphocytic cuff is present in the upper right of the panel. Hematoxylin-eosin stain; scale bar, 50 µm. (C) Portion of a chronic inactive plaque from the cerebellum. Note that the myelin in the upper portion of the panel is vesiculated but retains Luxol fast blue staining. Macrophages containing reddish PAS-stained debris and astrocytes obliterate normal white matter architecture in the bottom portion of the panel. Luxol fast blue-PAS-hematoxylin stain; scale bar, 50 µm. (D and E) Reduced number of axons in the center of a chronic inactive plaque (D) compared to normal axonal density in normal appearing white matter (E). Bielschowsky’s silver impregnation axonal stain; scale bar, 50 µm.
Figure 4
Figure 4. Demyelination and axonal loss in JME lesion
Immunofluorescent imaging from pontine lesion from JM #13221 identified by MRI (Figure 2J–L) .(A) The pontine lesion was double labeled for MBP (green) and NF (red) to visualize demyelination and loss of neurons. Area to the right of the solid line demarcates demyelinated lesion and shows marked reduction in staining for MBP and NF, indicating loss of myelin and axons; dashed line is lesion border with mix of damaged myelin and normal appearing myelin. Area to the left of the dashed line is unaffected white matter (WM) (5× magnification). (B) High magnification images of the lesion, border and unaffected white matter stained for the presence of MBP, NF and DAPI for nuclei to visualize the extent of demyelination and axonal damage. Note reduction in MBP and NF staining in both the lesion and border areas. The merged image of lesion and border reveals increased cellularity (increased DAPI staining), some preserved myelinated axons and some NF+ axons without myelin. (40× magnification). (C) A cerebellar lesion from JM #13221 showing CD68+ macrophages (red) and CD3+ T cells (green) near a venule (blue) (10× and 20× magnification, respectively). (D) The lesion site in (A) was immunostained for olig2 to assess the presence of oligodendrocytes and with a nuclear stain (DAPI) in the lesion, border and unaffected white matter (WM). Note the reduction in staining in the sections from the lesion and border areas for olig2 with increased numbers of DAPI+ cells (40× magnification). (E) Quantification of olig2 immuno-labeling. Three adjacent sections were analyzed and three random fields in each section were counted at the lesion, lesion border, and in adjacent white matter, showing significant reduction in olig2+ cells in the lesion and border compared with normal white matter (p<0.01).

Comment in

References

    1. Noseworthy JH, Lucchinetti C, Rodriguez M, Weinshenker BG. Multiple sclerosis. N Engl J Med. 2000 Sep 28;343(13):938–952. - PubMed
    1. Libbey J, Fujinami R. Potential Triggers of MS. In: Martin R, Lutterotti A, editors. Molecular Basis of Multiple Sclerosis. Springer Berlin / Heidelberg: 2010. pp. 21–42.
    1. Libbey JE, Fujinami RS. Experimental autoimmune encephalomyelitis as a testing paradigm for adjuvants and vaccines. Vaccine. 2010 Sep 16; (epub) - PMC - PubMed
    1. Ferraro A, Cazzullo CL. Chronic experimental allergic encephalomyelitis in monkeys. J Neuropathol Exp Neurol. 1948 Jul;7(3):235–260. - PubMed
    1. Genain CP, Hauser SL. Creation of a model for multiple sclerosis in Callithrix jacchus marmosets. J Mol Med. 1997 Mar;75(3):187–197. - PubMed

Publication types

MeSH terms

Substances