. 2012 Aug;33(8):1763-79.
doi: 10.1002/hbm.21318. Epub 2011 Jun 14.

Motor imagery evokes increased somatosensory activity in Parkinson's disease patients with tremor

Affiliations

Motor imagery evokes increased somatosensory activity in Parkinson's disease patients with tremor

Rick C Helmich et al. Hum Brain Mapp. 2012 Aug.

Abstract

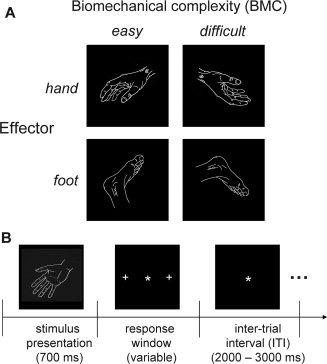
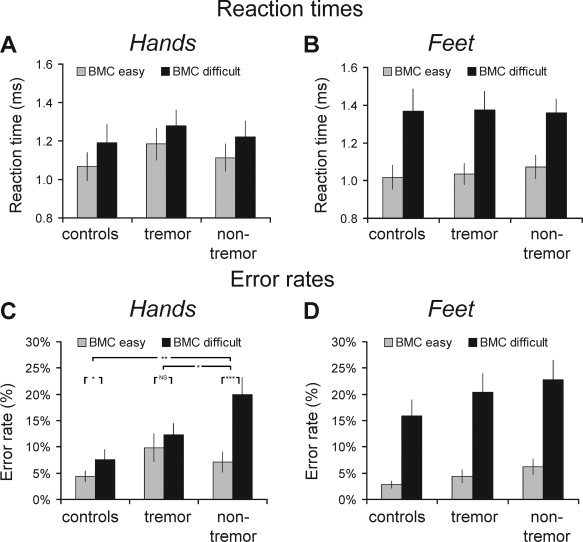
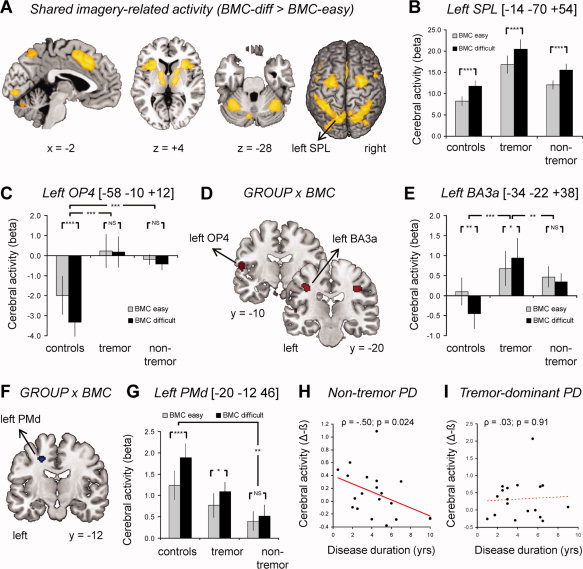
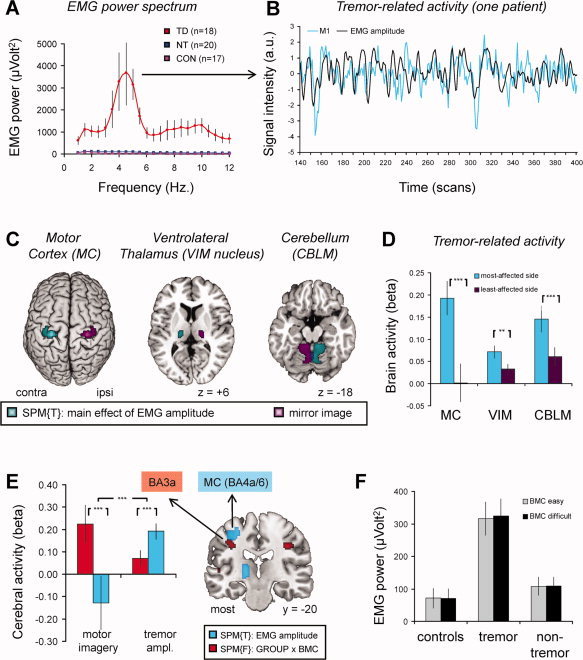
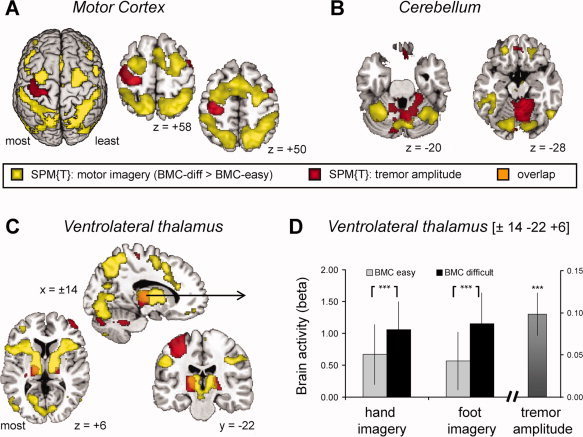
Parkinson's disease (PD) is surprisingly heterogeneous: some patients have a prominent resting tremor, while others never develop this symptom. Here we investigate whether the functional organization of the voluntary motor system differs between PD patients with and without resting tremor, and whether these differences relate to the cerebral circuit producing tremor. We compared 18 PD patients with marked tremor, 20 PD patients without tremor, and 19 healthy controls. Subjects performed a controlled motor imagery task during fMRI scanning. We quantified imagery-related cerebral activity by contrasting imagery of biomechanically difficult and easy movements. Tremor-related activity was identified by relating cerebral activity to fluctuations in tremor amplitude, using electromyography during scanning. PD patients with tremor had better behavioral performance than PD patients without tremor. Furthermore, tremulous PD patients showed increased imagery-related activity in somatosensory area 3a, as compared with both healthy controls and to nontremor PD patients. This effect was independent from tremor-related activity, which was localized to the motor cortex, cerebellum, and thalamic ventral intermediate nucleus (VIM). The VIM, with known projections to area 3a, was unique in showing both tremor- and imagery-related responses. We conclude that parkinsonian tremor influences motor imagery by modulating central somatosensory processing through the VIM. This mechanism may explain clinical differences between PD patients with and without tremor.


Figures

Figure 1
Figure 1
Experimental design. A: Experimental conditions. Subjects were presented with a picture of a hand or a foot, and they were asked to judge whether it represented a left or a right body part. There were two levels of motor planning difficulty, depending on the biomechanical complexity of the imagined movement towards the position indicated by the stimulus. B: Time course of one trial. The star indicates the fixation point; the crosses on the left and on the right indicate the targets for the saccade used by the subjects to respond during the imagery task. The drawings in Panels A and B illustrate representative stimuli configurations sampled from the set of 64 pictures used in this study.
Figure 2
Figure 2
Behavioral results: effects of biomechanical complexity. Reaction times (RT, in seconds; Panels A, B) and error rates (ER, in % correct; Panels C, D) for biomechanically easy (gray bars) and difficult (black bars) conditions are shown separately for hand (panels A‐C) and foot (panels B‐D) trials, across the three different groups (x‐axis). Subjects were consistently slower for biomechanically difficult (as compared with easy) trials; this effect was larger for foot than for hand stimuli, but it was equal across groups. Subjects made more errors for biomechanically difficult (as compared with easy) trials, and this effect was larger for foot than for hand stimuli. Nontremor PD patients had relatively high error rates specifically for imagery of biomechanically complex hand movements. Controls = 19 healthy controls; tremor = 18 PD patients with tremor; nontremor = 20 nontremor PD patients. In panel C, * indicates P < 0.05, ** indicates P < 0.01 and *** indicates P < 0.001. BMC = biomechanical.
Figure 3
Figure 3
Motor imagery‐related brain activity. Panels A and B show shared motor imagery‐related activity between the three groups. In panel A, the statistical parametric map (SPM, in yellow) of the t‐contrast: “biomechanically difficult > easy” [conjunction analysis over all groups; (Nichols et al.,2005)] is shown at an uncorrected threshold of P < 0.001 (for graphical purposes). In panel B, imagery‐related cerebral activity (mean beta values ± SEM, on the y‐axis) is plotted for the superior parietal lobule (SPL), shown separately for biomechanically easy and difficult conditions (colored bars) and across the three groups (x‐axis). Panels C–G show differential motor imagery‐related activity between the three groups. In panels D and F, the SPM of the F‐contrast: “GROUP × ORIENTATION interaction” is shown at an uncorrected threshold of P < 0.001 (for graphical purposes), superimposed on three coronal sections of a representative brain of the MNI series. Panels C, E, and G show the effects size (mean beta values ± SEM, on the y‐axis) of imagery‐related cerebral activity in the left BA3a (panel C), left OP4 (panel E) and left PMd (panel G), plotted separately for biomechanically easy and difficult conditions (colored bars) and across the three groups (x‐axis). Panels H and I show that imagery‐related activity in the left PMd (difference between beta values for biomechanically difficult and easy trials, on the y‐axis) decreased as a function of disease duration (in years, on the x‐axis) for nontremor PD patients (panel H), but not for PD patients with tremor (panel I). In panels C, E, and G, * indicates P < 0.05, ** indicates P < 0.01 and *** indicates P < 0.001. NS indicates no significant difference. BA, Brodmann area. Other conventions as in Figure 2. [Color figure can be viewed in the online issue, which is available at wileyonlinelibrary.com.]
Figure 4
Figure 4
Tremor‐related brain activity. Panel A shows rectified EMG power (y‐axis) as a function of frequency (x‐axis), averaged across 18 PD patients with tremor (in red), 17 controls (in violet) and 20 nontremor PD patients (in blue). For each patient, a regressor describing scan‐by‐scan variations in EMG power at tremor frequency (∼4 to 5 Hz) was used to localize brain regions with tremor‐related responses (i.e., regions where cerebral activity cofluctuated with tremor amplitude). Panel B illustrates this procedure for one patient, over a period of 260 scans (∼10 min, on the x‐axis). In this patient, cerebral activity in the contralateral motor cortex (M1, blue line, time course filtered at f > 0.008 and z‐normalized) was correlated with tremor amplitude (black line, z‐normalized). Panel C shows the anatomical distribution of tremor amplitude‐related brain activity (in cyan, SPM of a t‐contrast across 18 PD patients with tremor, shown at an uncorrected threshold of P < 0.001). The left side represents the side contralateral to the tremulous hand. In purple, the homotopic regions in the other (least‐affected) hemisphere are shown. Panel D shows the tremor‐related responses (mean beta values ± SEM, on the y‐axis) for the motor cortex (MC, BA4a/6), ventrolateral thalamus (VIM nucleus) and cerebellum (CBLM), separately for the most‐affected hemisphere (blue bars) and for the least‐affected hemisphere (purple bars). Panel E shows that the imagery‐related effects in BA3a (in red, same contrast as in Fig. 3D) are independent from the tremor‐related effects in neighboring BA4a/6 (in blue, same contrast as in panel C). That is, imagery‐related brain activity was significantly larger in BA3a than in BA4a/6 (left two bars, the y‐axis shows the difference between biomechanically difficult and easy conditions; average ± SEM). Conversely, tremor‐related brain activity was significantly larger in BA4a/6 than BA3a (right two bars, the y‐axis shows the average beta value ± SEM). Panel F shows rectified EMG power (average ± SEM, on the y‐axis) during imagery of biomechanically easy and difficult movements (colored bars), across the three groups (x‐axis). The results show increased EMG activity in PD patients with tremor compared to controls and nontremor PD patients, but EMG power was not modulated by the biomechanical complexity (BMC) of the imagined movement. Other conventions as in Figures 2 and 3. [Color figure can be viewed in the online issue, which is available at wileyonlinelibrary.com.]
Figure 5
Figure 5
Overlap between imagery‐ and tremor‐related brain activity. Panels A–C show the anatomical distribution of tremor‐related brain activity (in yellow, SPM of the t‐contrast: “biomechanically difficult > easy”) and tremor‐related brain activity (in red, SPM of the t‐contrast: “tremor amplitude”) across 18 PD patients with tremor. Both contrasts are shown at a threshold of P < 0.01 uncorrected, to best visualize the pattern of overlap and segregation. Panel A focuses on the motor cortex, Panel B on the cerebellum and Panel C on the thalamus. The results demonstrate that imagery‐ and tremor‐related effects are clearly separated in the motor cortex and cerebellum, but that they overlap in the ventrolateral thalamus (orange voxels in Panel C). Panel D shows both imagery‐related activity (indexed by larger activity for biomechanically difficult than easy trials, colored bars on the left side) and tremor‐related responses (indexed by cofluctuation of cerebral activity with tremor amplitude, bar on the right side) in a thalamic voxel where these two effects converged [tested with a conjunction analysis; (Nichols et al.,2005)]. [Color figure can be viewed in the online issue, which is available at wileyonlinelibrary.com.]

References

    1. Alves G, Larsen JP, Emre M, Wentzel‐Larsen T, Aarsland D ( 2006): Changes in motor subtype and risk for incident dementia in Parkinson's disease. Mov Disord 21: 1123–1130. - PubMed
    1. Ashburner J, Friston K ( 1997): Multimodal image coregistration and partitioning—A unified framework. Neuroimage 6: 209–217. - PubMed
    1. Behrens TE, Johansen‐Berg H, Woolrich MW, Smith SM, Wheeler‐Kingshott CA, Boulby PA, Barker GJ, Sillery EL, Sheehan K, Ciccarelli O, Thompson AJ, Brady JM, Matthews PM ( 2003): Non‐invasive mapping of connections between human thalamus and cortex using diffusion imaging. Nat Neurosci 6: 750–757. - PubMed
    1. Benabid AL, Pollak P, Gervason C, Hoffmann D, Gao DM, Hommel M, Perret JE, de Rougemont J ( 1991): Long‐term suppression of tremor by chronic stimulation of the ventral intermediate thalamic nucleus. Lancet 337: 403–406. - PubMed
    1. Beuter A, Barbo E, Rigal R, Blanchet PJ ( 2005): Characterization of subclinical tremor in Parkinson's disease. Mov Disord 20: 945–950. - PubMed