. 2011 Jul 15;83(14):5754-61.
doi: 10.1021/ac201123t. Epub 2011 Jun 28.

Direct plant tissue analysis and imprint imaging by desorption electrospray ionization mass spectrometry

Affiliations
Free PMC article

Direct plant tissue analysis and imprint imaging by desorption electrospray ionization mass spectrometry

Thomas Müller et al. Anal Chem. .
Free PMC article

Abstract

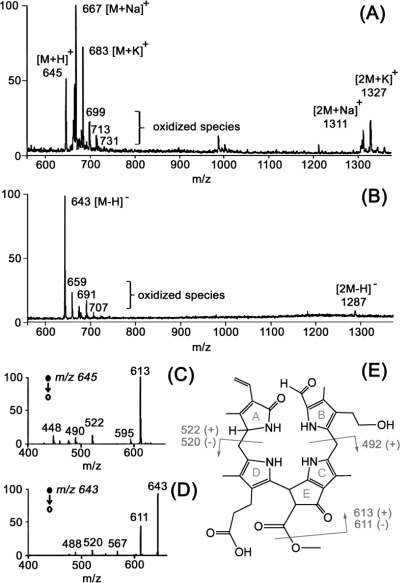
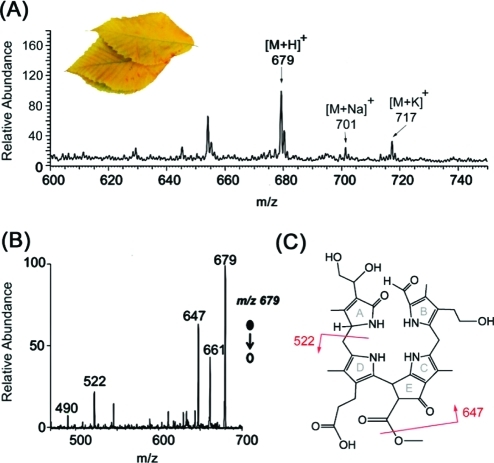
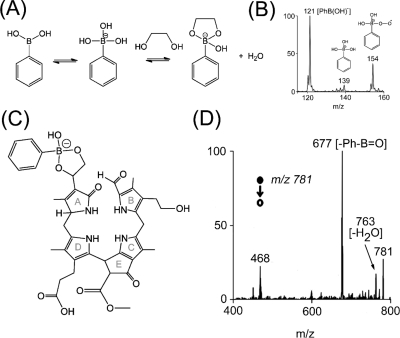
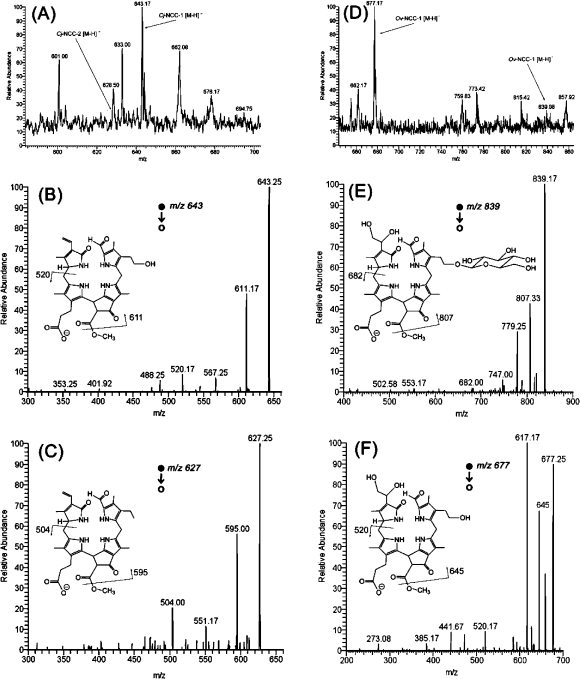
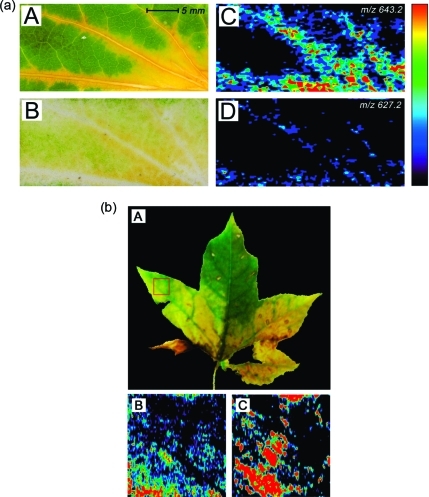
The ambient mass spectrometry technique, desorption electrospray ionization mass spectrometry (DESI-MS), is applied for the rapid identification and spatially resolved relative quantification of chlorophyll degradation products in complex senescent plant tissue matrixes. Polyfunctionalized nonfluorescent chlorophyll catabolites (NCCs), the "final" products of the chlorophyll degradation pathway, are detected directly from leaf tissues within seconds and structurally characterized by tandem mass spectrometry (MS/MS) and reactive-DESI experiments performed in situ. The sensitivity of DESI-MS analysis of these compounds from degreening leaves is enhanced by the introduction of an imprinting technique. Porous polytetrafluoroethylene (PTFE) is used as a substrate for imprinting the leaves, resulting in increased signal intensities compared with those obtained from direct leaf tissue analysis. This imprinting technique is used further to perform two-dimensional (2D) imaging mass spectrometry by DESI, producing well-resolved images of the spatial distribution of NCCs in senescent leaf tissues.


Figures

Figure 1
Figure 1
(A, B) DESI-MS spectra of a 3 mm spot of Cj-NCC-1 standard on a PTFE surface. Spray solvent was methanol/water (20:80) at a flow rate of 3 μL/min. (A) Positive ion mode DESI-MS spectrum. Protonated, sodiated, and potassiated molecules were detected at m/z 645, 667, and 683, respectively; the dimer, at m/z 1311. (B) Negative ion mode DESI-MS. Ions corresponding to deprotonated molecules were observed at m/z 643, and its dimer, at m/z 1287. (C) Positive ion mode DESI-MS/MS spectrum of the protonated molecule, m/z 645. (D) Negative ion mode DESI-MS/MS spectrum of the deprotonated molecule, m/z 643. (E) Constitutional formula of Cj-NCC-1,(45) characteristic CID fragmentations observed in positive ion mode (+) and negative ion mode (−) are highlighted in gray.
Figure 2
Figure 2
(A) Positive ion mode DESI-MS spectrum of the direct analysis of a hophornbeam (O. virginiana) leaf. Spray solvent was methanol/water (80:20) at a flow rate of 3 μL/min. Protonated, sodiated, and potassiated molecules were detected at m/z 679, 701, and 717, respectively. (B) DESI-MS/MS spectrum of the isolated protonated molecule, m/z 679. (C) Proposed structure of the chlorophyll catabolite corresponding to the ion at m/z 679, the Ov-NCC-1. The structure shown is proposed considering previous data., Characteristic fragmentations due to the losses of methanol (fragment at m/z 647) and ring A (fragment at m/z 522) are marked.
Figure 3
Figure 3
(A) Rapid and reversible covalent complexation of phenylboronic acid with 1,2-diols to form cyclic boronates in basic aqueous media.(53) (B) Reactive species generated in solution and detected during reactive DESI-MS. (C) Proposed structure of the cyclization product of phenylboronic acid and the chlorophyll catabolite. (D) Negative ion mode reactive DESI-MS/MS spectrum of a hophornbeam (O. virginiana) leaf extract spotted on a PTFE surface. Spray solvent at a flow rate of 3 μL/min was 3 mM phenylboronic acid reduced to pH 9 using aqueous ammonia. The deprotonated cyclization product of phenylboronic acid and the chlorophyll catabolite at m/z 781 showed characteristic loss of Ph-B=O.
Figure 4
Figure 4
Negative ion mode DESI-MS spectra of PTFE leaf imprints. Spray solvent was 1% concentrated aqueous ammonia in methanol at a flow rate of 3 μL/min. (A) DESI-MS spectrum of a Katsura tree (C. japonicum) leaf imprint. (B, C) DESI-MS/MS spectra of the deprotonated molecules, m/z 643 and 627, corresponding to the two known chlorophyll catabolites in C. japonicum., Characteristic fragmentations due to the losses of methanol, and ring A are highlighted in the depicted structures. (D) DESI-MS spectrum of a hophornbeam (O. virginiana) leaf imprint. (E, F) DESI-MS/MS spectra of the deprotonated molecules, m/z 677 and 839, corresponding to the two chlorophyll catabolites found in O. virginiana. Characteristic fragmentations due to the losses of methanol, and ring A are highlighted in the inserted structures (proposed considering data for constitutionally identical compounds described in the literature,,,).
Figure 5
Figure 5
(a) Negative ion mode DESI imaging of a senescent Katsura tree leaf imprint on porous PTFE substrate. Spray solvent was 1% concentrated aqueous ammonia in methanol at a flow rate of 1.5 μL/min. Imaging parameters: 1.17 s/scan; 98 scans/horizontal row; 56 rows; pixel size was 310 × 250 μm; total acquisition time was 107 min. (A) 30.7 × 13.9 mm section of a photographic image taken from a senescent Katsura leaf. (B) 30.7 × 13.9 mm porous PTFE substrate with Katsura leaf imprint. (C, D) Ion images of the two chlorophyll catabolites, in Katsura leaves at m/z 643.2 and 627.2. Both images are plotted on the same color scale, which is depicted on the right-hand side of the figure to visualize relative ion intensities from 0 (black) to 100 (red). (b) Negative ion mode DESI imaging of a senescent American sweetgum leaf imprint on porous PTFE substrate. Spray solvent was 1% concentrated aqueous ammonia in methanol at a flow rate of 1.5 μL/min. Imaging parameters: 0.72 s/scan; 119 scans/horizontal row; 50 rows; pixel size was 130 × 300 μm; total acquisition time was 71 min. (A) Photographic image taken from a senescent American sweetgum leaf. The rastered 15 × 15 mm section is highlighted in red. (B, C) Ion images of the two chlorophyll catabolites found in American sweetgum(46) at m/z 643.2 and 627.2. Both images are plotted on the same color scale, which is depicted on the right-hand side of panel a to visualize relative ion intensities from 0 (black) to 100 (red).

References

    1. Kräutler B.; Matile P. Acc. Chem. Res. 1999, 32, 35–43.
    1. Brown S. B.; Houghton J. D.; Hendry G. A. F. In Chlorophylls; Scheer H., Ed.; CRP-Press: Boca Raton, FL, 1991; pp 465–489.
    1. Kräutler B.; Jaun B.; Bortlik K.; Schellenberg M.; Matile P. Angew. Chem. Int. Ed. 1991, 30, 1315–1318.
    1. Kräutler B.; Hörtensteiner S. In Chlorophylls and Bacteriochlorophylls. Biochemistry, Biophysics, Functions and Applications, Advances in Photosynthesis and Respiration; Grimm B., Porra R., Rüdiger W., Scheer H., Eds.; Springer: Dordrecht, The Netherlands, 2006; Vol. 25; pp 237–260.
    1. Hörtensteiner S.; Kräutler B.. Biochim. Biophys. Acta 2010, DOI:10.1016/j.bbabio.2010.12.007. - PubMed

Publication types

MeSH terms