. 2011 Jun;89(2):289-332.
doi: 10.1111/j.1468-0009.2011.00629.x.

An economic history of Medicare part C

Affiliations

An economic history of Medicare part C

Thomas G McGuire et al. Milbank Q. 2011 Jun.

Erratum in

  • Milbank Q. 2013 Mar;91(1):210

Abstract

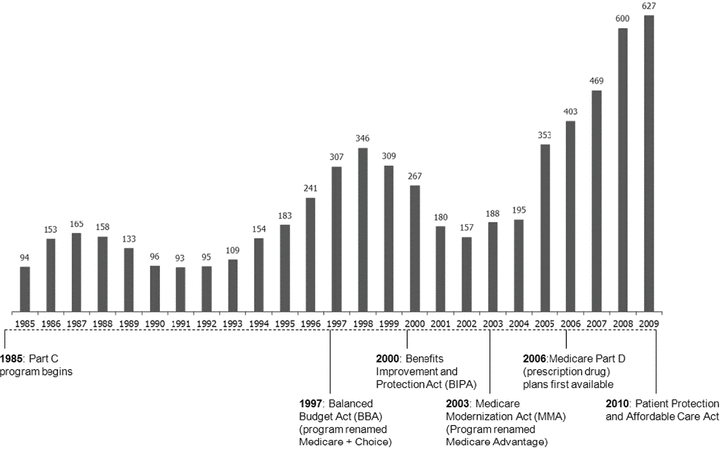
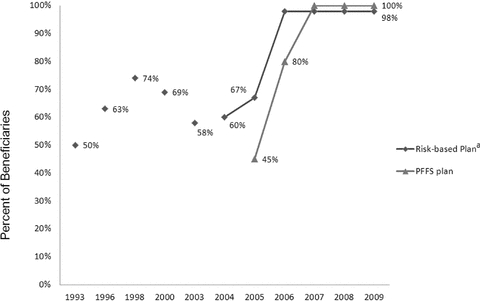
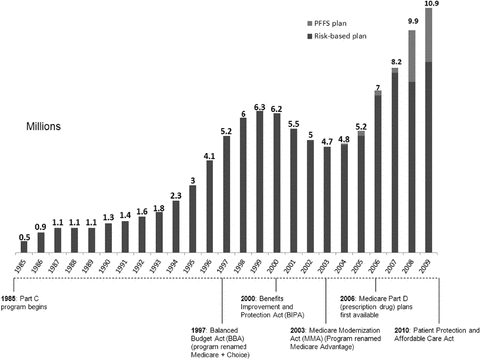
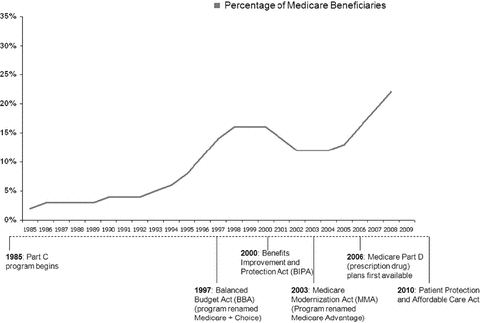
Context: Twenty-five years ago, private insurance plans were introduced into the Medicare program with the stated dual aims of (1) giving beneficiaries a choice of health insurance plans beyond the fee-for-service Medicare program and (2) transferring to the Medicare program the efficiencies and cost savings achieved by managed care in the private sector.

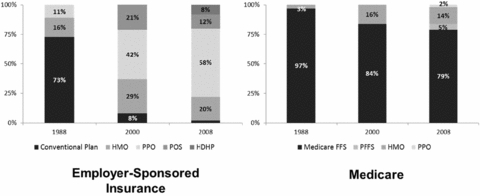
Methods: In this article we review the economic history of Medicare Part C, known today as Medicare Advantage, focusing on the impact of major changes in the program's structure and of plan payment methods on trends in the availability of private plans, plan enrollment, and Medicare spending. Additionally, we compare the experience of Medicare Advantage and of employer-sponsored health insurance with managed care over the same time period.

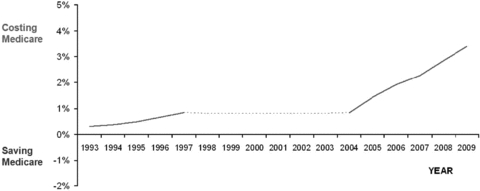
Findings: Beneficiaries' access to private plans has been inconsistent over the program's history, with higher plan payments resulting in greater choice and enrollment and vice versa. But Medicare Advantage generally has cost more than the traditional Medicare program, an overpayment that has increased in recent years.

Conclusions: Major changes in Medicare Advantage's payment rules are needed in order to simultaneously encourage the participation of private plans, the provision of high-quality care, and to save Medicare money.


Figures

FIGURE 1
FIGURE 1
Insurance Companies' “Contracts” with Medicare Insurers like Blue Cross or Aetna hold Medicare Advantage “contracts” with CMS. For each type of product such as an HMO or a PPO, the insurer generally has one contract for an entire state or the part of the state that is the insurer's service area. Each contract holder may, and typically does, offer several benefit packages under each contract. The benefit packages specify the services covered, the cost sharing, and the premium. In the figure, MA refers to a plan that does not cover drugs, and MA PD indicates plans that, as of 2006, do cover drugs. Private-Fee-for-Service plans are described in the text.
FIGURE 2
FIGURE 2
Total Number of Medicare Advantage Contracts Note: Contracts include local Coordinated Care Plans (risk-based HMOs plus PPOs), Private Fee-For-Service plans, and regional PPOs. Source: CMS, Medicare Managed Care Contract (MMCC) Plans Monthly Summary Report. All data are from December of the year indicated, except those for November, in 2007.
FIGURE 3
FIGURE 3
Medicare Beneficiaries' Access to an MA Plan Note: aIncludes HMO, local PPO, and regional PPO plans. Sources: MedPAC 1998, ; Zarabozo 2000.
FIGURE 4
FIGURE 4
Enrollments in Medicare Advantage Plans Source: CMS, Medicare Managed Care Contract (MMCC) Plans Monthly Summary Report. All data are from December of the year indicated, except those from November, in 2007.
FIGURE 5
FIGURE 5
Percentage of Medicare Beneficiaries in Medicare Advantage Plans Source: CMS, Medicare Managed Care Contract (MMCC) Plans Monthly Summary Report. All data are from December of the year indicated, except those from November, in 2007.
FIGURE 6
FIGURE 6
The Net Effect of Medicare Advantage Plans on Medicare Spending Note: Our calculations are based on MedPAC Reports to Congress 1998–2010 and CMS Monthly Contract and Summary Reports 1993–2009. The values are the product of the percentage in MA and the estimated percentage of over- or underpayment. Dotted lines indicate no data available.
FIGURE 7
FIGURE 7
Enrollment by Plan Type: Medicare vs. Employer-Sponsored Insurance Sources: The 2008 Medicare data are from MedPAC 2010c; the 1988 and 2000 Medicare data are from CMS MMCC Plans Monthly Summary Reports; the Employer-Sponsored Insurance data are from KFF/HRET Employer Health Benefits Annual Survey Chart Pack 2009.
FIGURE 8
FIGURE 8
Nominal and Real Median Net Income for Physicians, 1990–2000 Notes: *Real income deflated by the all-item CPI. **CAGR = compound annual growth rate, a measure of annualized growth over a given time period. Source:Kane and Loeblich 2003.

References

    1. Aaron H, Reischauer R. The Medicare Reform Debate: What Is the Next Step? Health Affairs. 1995;14(4):8–31. - PubMed
    1. Achman L, Gold M. Are the 2004 Payment Increases Helping to Stem Medicare Advantage's Benefit Erosion? The Commonwealth Fund. Commonwealth Fund Publication. 2004 no. 795.
    1. Atherly A. Supplemental Insurance: Medicare's Accidental Stepchild. Medical Care Research and Review. 2001;58(2):131–61. - PubMed
    1. Balsa AI, Cao Z, McGuire TG. Does Managed Health Care Reduce Health Care Disparities between Minorities and Whites? Journal of Health Economics. 2007;26:1101–21. - PubMed
    1. Barr MS, Foote SM, Krakauer R, Mattingly PH. Lessons for the New CMS Innovation Center from the Medicare Health Support Program. Health Affairs. 2010;29(7):1305–9. - PubMed

MeSH terms