

Drastic historic shifts in bumble-bee community composition in Sweden
- PMID: 21676979
- PMCID: PMC3223670
- DOI: 10.1098/rspb.2011.0647
Drastic historic shifts in bumble-bee community composition in Sweden
Abstract
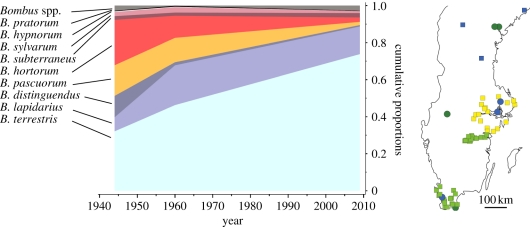
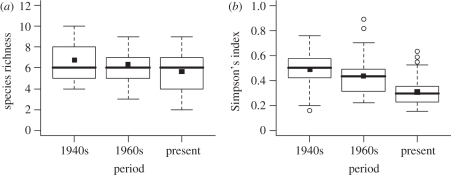
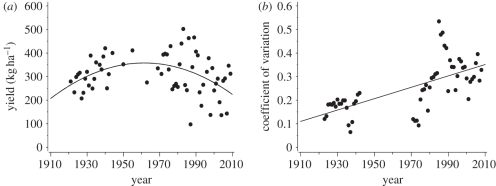
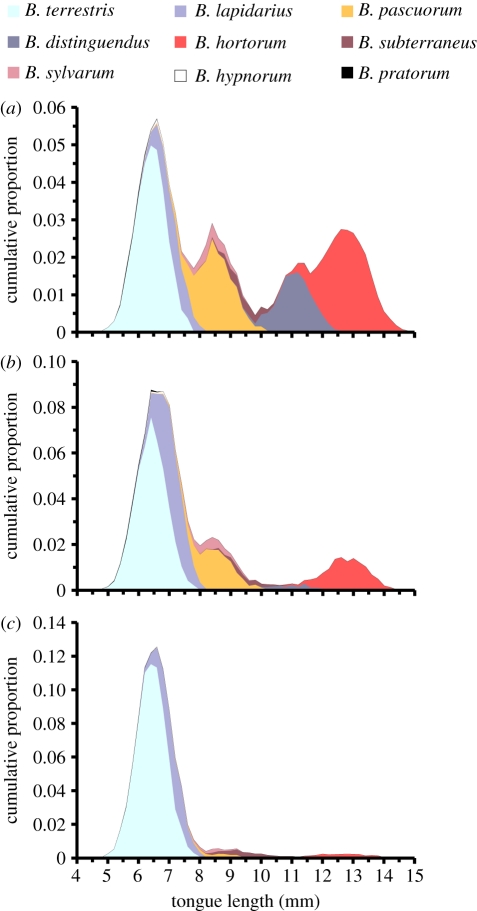
The species richness of flower-visiting insects has declined in past decades, raising concerns that the ecosystem service they provide by pollinating crops and wild plants is threatened. The relative commonness of different species with shared ecological traits can play a pervasive role in determining ecosystem functioning, but information on changes in abundances of pollinators over time is lacking. We gathered data on relative abundances of bumble-bee species in Swedish red clover fields during three periods in the last 70 years (1940s, 1960s and present), and on clover seed yields since 1921. We found drastic decreases in bumble-bee community evenness, with potential consequences for level and stability of red clover seed yield. The relative abundances of two short-tongued bumble-bees have increased from 40 per cent in the 1940s to entirely dominate present communities with 89 per cent. Average seed yield declined in recent years and variation in yield doubled, suggesting that the current dependence on few species for pollination has been especially detrimental to stability in seed yield. Our results suggest a need to develop management schemes that promote not only species-rich but also more evenly composed communities of service-providing organisms.
Figures
References
-
- Biesmeijer J. C., et al. 2006. Parallel declines in pollinators and insect-pollinated plants in Britain and the Netherlands. Science 313, 351–354 10.1126/science.1127863 (doi:10.1126/science.1127863) - DOI - PubMed
-
- Potts S. G., Biesmeijer J. C., Kremen C., Neumann P., Schweiger O., Kunin W. E. 2010. Global pollinator declines: trends, impacts and drivers. Trends Ecol. Evol. 25, 345–354 10.1016/j.tree.2010.01.007 (doi:10.1016/j.tree.2010.01.007) - DOI - PubMed
-
- Goulson D., Lye G. C., Darvill B. 2008. Decline and conservation of bumble bees. Annu. Rev. Entomol. 53, 191–208 10.1146/annurev.ento.53.103106.093454 (doi:10.1146/annurev.ento.53.103106.093454) - DOI - PubMed
-
- Williams P. H., Osborne J. L. 2009. Bumblebee vulnerability and conservation world-wide. Apidologie 40, 367–387 10.1051/apido/2009025 (doi:10.1051/apido/2009025) - DOI
-
- Cameron S. A., Lozier J. D., Strange J. P., Koch J. B., Cordes N., Solter L. F., Griswold T. L. 2011. Patterns of widespread decline in North American bumble bees. Proc. Natl Acad. Sci. USA 108, 662–667 10.1073/pnas.1014743108 (doi:10.1073/pnas.1014743108) - DOI - PMC - PubMed
Publication types
MeSH terms
LinkOut - more resources
Full Text Sources
Miscellaneous