. 2011 Jun 15;31(24):8862-9.
doi: 10.1523/JNEUROSCI.1617-11.2011.

Loss of Tsc1 in vivo impairs hippocampal mGluR-LTD and increases excitatory synaptic function

Affiliations

Loss of Tsc1 in vivo impairs hippocampal mGluR-LTD and increases excitatory synaptic function

Helen S Bateup et al. J Neurosci. .

Abstract

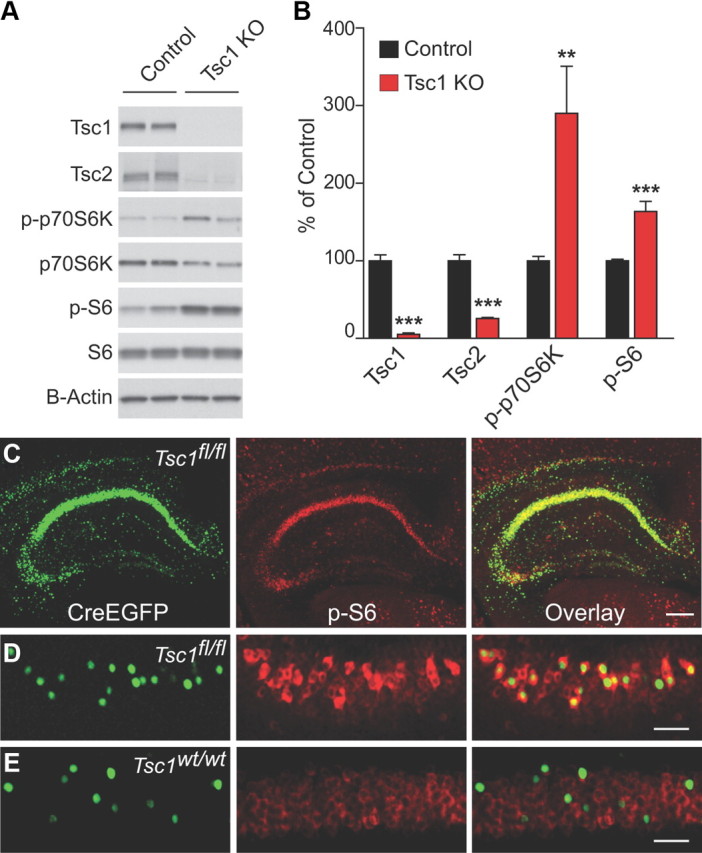
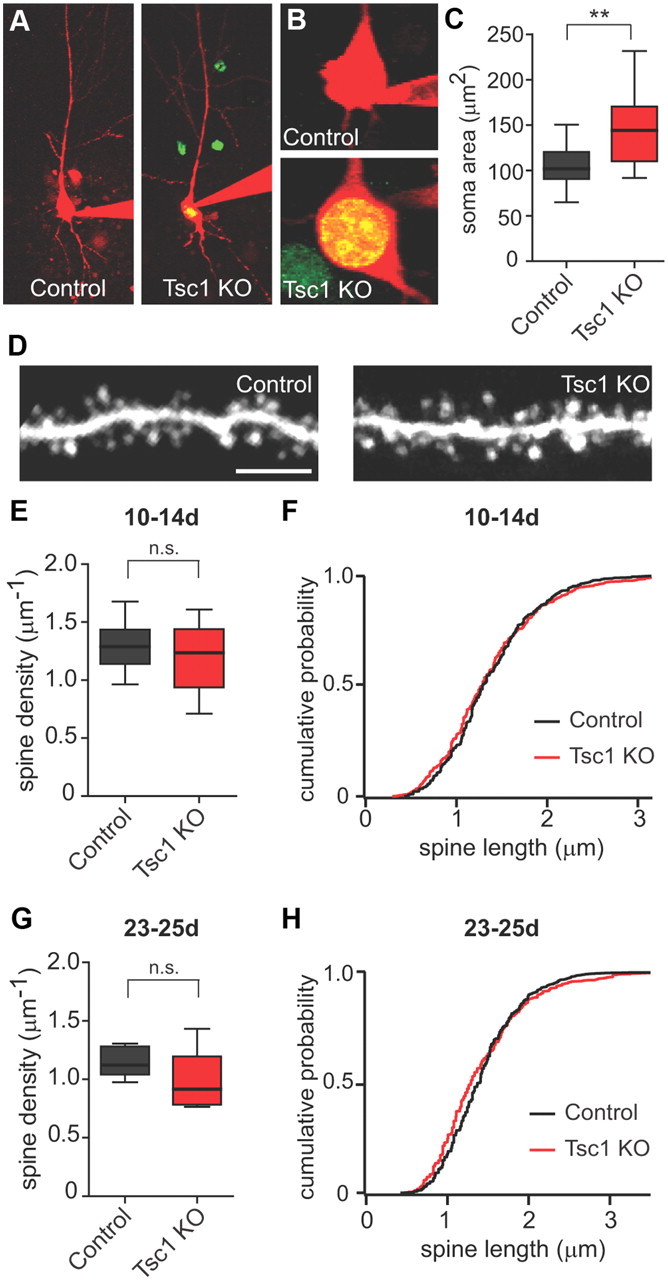
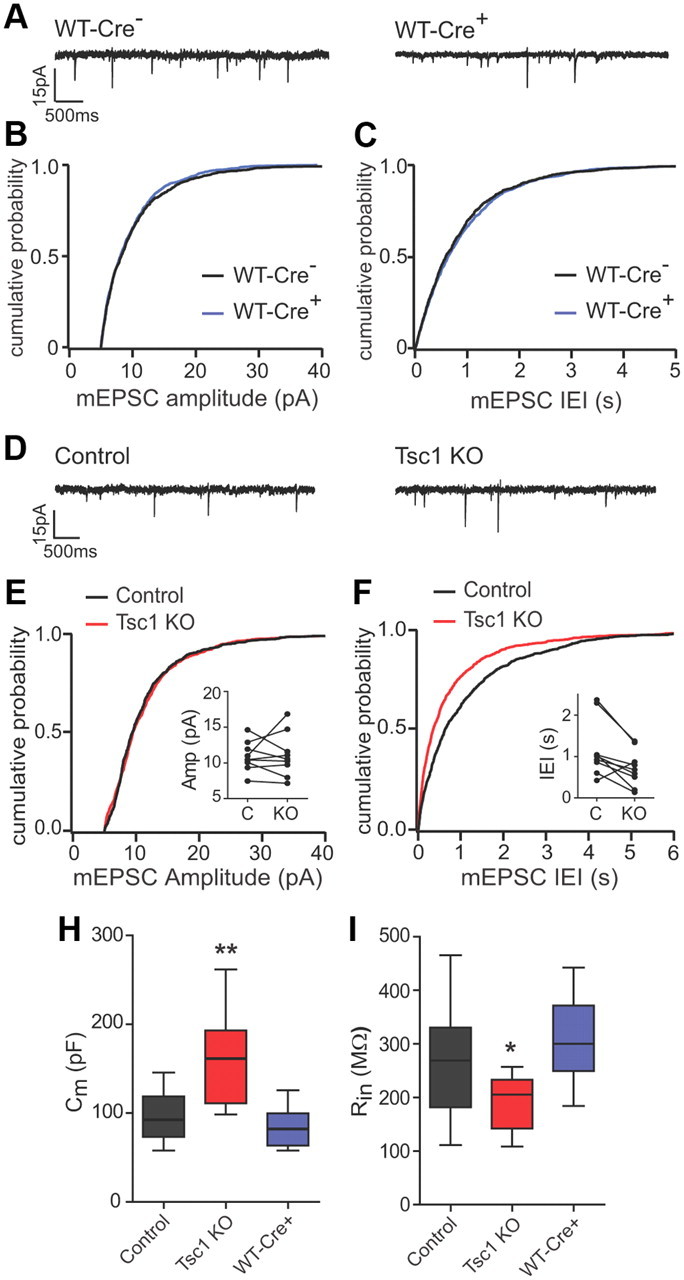
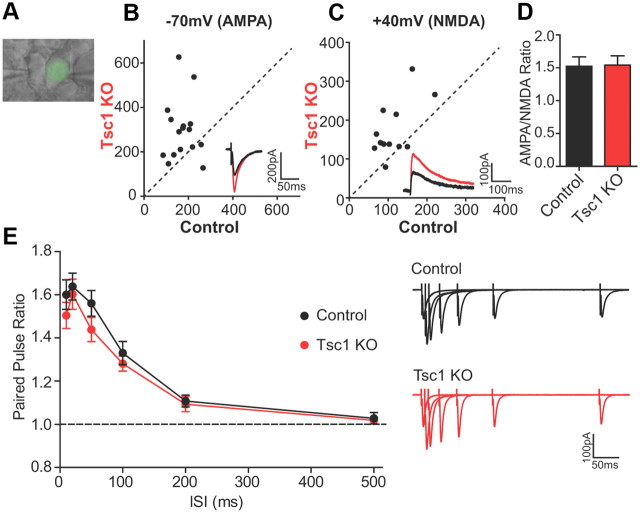
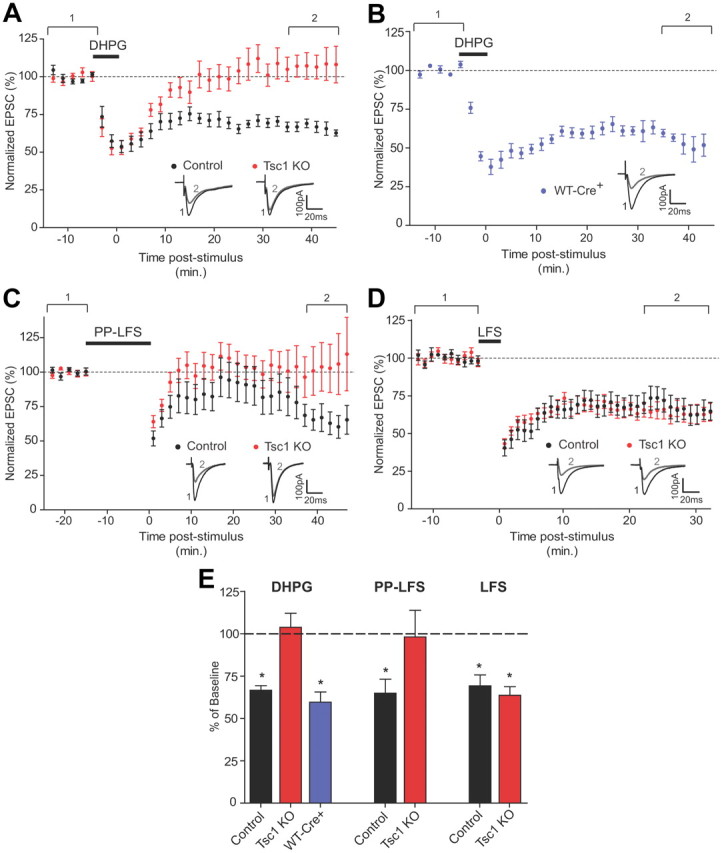
The autism spectrum disorder tuberous sclerosis complex (TSC) is caused by mutations in the Tsc1 or Tsc2 genes, whose protein products form a heterodimeric complex that negatively regulates mammalian target of rapamycin-dependent protein translation. Although several forms of synaptic plasticity, including metabotropic glutamate receptor (mGluR)-dependent long-term depression (LTD), depend on protein translation at the time of induction, it is unknown whether these forms of plasticity require signaling through the Tsc1/2 complex. To examine this possibility, we postnatally deleted Tsc1 in vivo in a subset of hippocampal CA1 neurons using viral delivery of Cre recombinase in mice. We found that hippocampal mGluR-LTD was abolished by loss of Tsc1, whereas a protein synthesis-independent form of NMDA receptor-dependent LTD was preserved. Additionally, AMPA and NMDA receptor-mediated EPSCs and miniature spontaneous EPSC frequency were enhanced in Tsc1 KO neurons. These changes in synaptic function occurred in the absence of alterations in spine density, morphology, or presynaptic release probability. Our findings indicate that signaling through Tsc1/2 is required for the expression of specific forms of hippocampal synaptic plasticity as well as the maintenance of normal excitatory synaptic strength. Furthermore, these data suggest that perturbations of synaptic signaling may contribute to the pathogenesis of TSC.


Figures

Figure 1.
Figure 1.
Conditional deletion of Tsc1 in hippocampal neurons. A, Representative Western blots from Tsc1fl/fl-dissociated hippocampal cultures. Control, treated with GFP lentivirus; Tsc1 KO, treated with GFP-IRES-Cre lentivirus. B, Quantification of Western blots for the indicated proteins expressed as a percentage of control. Bars represent mean ± SEM (n = 8–17; **p < 0.01; ***p < 0.001). C, Section from a Tsc1fl/fl mouse stereotaxically injected with AAV-CreEGFP demonstrating robust hippocampal expression. Green, Nuclear CreEGFP fluorescence; Red, immunohistochemistry staining for phosphorylated S6 (p-S6, Ser240/244). Right, Overlaid CreEGFP and anti-pS6 fluorescence. Scale bar, 250 μm. D, CreEGFP-expressing CA1 neurons from a sparsely infected Tsc1fl/fl mouse show upregulation of p-S6. Scale bar, 100 μm. E, CreEGFP-expressing CA1 neurons from a Tsc1w/w mouse do not show upregulation of p-S6.
Figure 2.
Figure 2.
Neuronal and spine morphology of Tsc1 KO neurons in vivo. A, 2-photon images of Control (CreEGFP negative) and Tsc1 KO (CreEGFP positive) CA1 neurons 10–14 d following AAV-CreEGFP injection into a Tsc1fl/fl mouse. B, 2-photon images of somas from Control (top) and Tsc1 KO (bottom) neurons. C, Box-plot summary of soma area (in μm2) (n = 17–19; **p < 0.01). D, 2-photon images of apical dendritic spines from control and Tsc1 KO neurons. Scale bar, 5 μm. E, G, Box-plot summaries of spine density (spines per μm of dendrite) 10–14 d (E) or 23–25 d (G) post-injection (n = 11–12 neurons. n.s., Not significant. F, H, Cumulative distributions of spine length (in micrometers) from control (black traces) and Tsc1 KO (red traces) neurons 10–14 d (F) or 23–25 d (H) post-injection.
Figure 3.
Figure 3.
Basal synaptic function and intrinsic membrane properties in Tsc1 KO neurons. A, D, Representative traces of mEPSCs recorded from CreEGFP-negative (left) and CreEGFP-positive (right) CA1 neurons from virus-injected C57BL/6 (WT, A) or Tsc1fl/fl mice (D). B, C, Cumulative distributions of mEPSC amplitudes (pA) (B) and inter-event intervals (in seconds) (C) from CreEGFP-negative (black traces) and CreEGFP-positive (blue traces) neurons from C57BL/6 mice. E, F, Cumulative distributions of mEPSC amplitudes (pA) (E) and interevent intervals (in seconds) (F) from control (black traces) and Tsc1 KO (red traces) neurons from Tsc1fl/fl mice. Insets show pairwise comparisons of the averages for each cell. H, I, Box-plot summaries of membrane capacitance (H) and resting membrane resistance (I) from CA1 neurons of the indicated genotypes measured 10–14 d after AAV-CreEGFP injection. (n = 8–14; *p < 0.05; **p < 0.01). Control, CreEGFP-negative neurons from a Tsc1fl/fl mouse; Tsc1 KO, CreEGFP-positive neurons from a Tsc1fl/fl mouse, WT-Cre+; CreEGFP-positive neurons from a C57BL/6 mouse.
Figure 4.
Figure 4.
Evoked AMPA and NMDA receptor synaptic currents are increased in Tsc1 KO neurons. A, Differential interference contrast image overlaid with EGFP fluorescence. Example of a paired recording between neighboring CreEGFP-negative (control, left) and CreEGFP-positive (Tsc1 KO, right) neurons. EPSCs were induced by Schaffer collateral stimulation. B, C, Scatter plots of EPSC amplitude from pairs of control and Tsc1 KO CA1 neurons recorded at −70 mV (B, primarily AMPAR currents) and at +40 mV (C, primarily NMDAR currents). Insets show representative traces from the same pair of neurons. Control, Black traces; Tsc1 KO, red traces. D, Mean AMPA/NMDA ratio ± SEM from control and Tsc1 KO neurons (n = 13). E, Mean paired-pulse ratio ± SEM from control and Tsc1 KO neurons measured at different ISIs (n = 10–11). PPR >1 indicates facilitation. Representative overlaid traces from individual neurons showing pairs of EPSCs recorded at −70 mV for each ISI.
Figure 5.
Figure 5.
mGluR-LTD is selectively disrupted in Tsc1 KO neurons. A–D, Mean EPSC amplitude ± SEM expressed as a percentage of baseline plotted versus time in minutes. Dashed lines indicate the average baseline response. Insets show representative EPSCs. Black traces represent the average response from the 10 min baseline period (1). Gray traces represent the average response during the last 10 min (2). A, B, mGluR-LTD was induced by a 5 min wash-in of 100 μm DHPG. A, Tsc1fl/fl mice: control, CreEGFP-negative neurons (n = 9 cells); Tsc1 KO, CreEGFP-positive neurons (n = 8 cells). B, WT-Cre+, CreEGFP-positive neurons from C57BL/6 mice (n = 8). C, mGluR-LTD was induced by PP-LFS, consisting of 900 pairs of stimuli (50 ms ISI) delivered at 1 Hz in the presence of d-APV (n = 10). D, NMDA-dependent LTD was induced by LFS consisting of 5 Hz stimulation for 3 min at −40 mV (n = 8–9). E, Summary data showing the mean ± SEM response measured during the last 10 min of each recording expressed as a percentage of the 10 min baseline period for the indicated genotypes. Dashed line at 100% indicates the baseline. Left bars (DHPG) represent data from A and B, middle bars (PP-LFS) are from C, right bars (LFS) are from D. *Significant difference from 100%, p < 0.01.

References

    1. Bourgeron T. A synaptic trek to autism. Curr Opin Neurobiol. 2009;19:231–234. - PubMed
    1. Ceman S, O'Donnell WT, Reed M, Patton S, Pohl J, Warren ST. Phosphorylation influences the translation state of FMRP-associated polyribosomes. Hum Mol Genet. 2003;12:3295–3305. - PubMed
    1. Chong-Kopera H, Inoki K, Li Y, Zhu T, Garcia-Gonzalo FR, Rosa JL, Guan KL. TSC1 stabilizes TSC2 by inhibiting the interaction between TSC2 and the HERC1 ubiquitin ligase. J Biol Chem. 2006;281:8313–8316. - PubMed
    1. Collingridge GL, Peineau S, Howland JG, Wang YT. Long-term depression in the CNS. Nat Rev Neurosci. 2010;11:459–473. - PubMed
    1. Costa-Mattioli M, Sossin WS, Klann E, Sonenberg N. Translational control of long-lasting synaptic plasticity and memory. Neuron. 2009;61:10–26. - PMC - PubMed

Publication types

MeSH terms