

doi: 10.1523/JNEUROSCI.0702-11.2011.
Constructing realistic engrams: poststimulus activity of hippocampus and dorsal striatum predicts subsequent episodic memory
Affiliations
- PMID: 21677186
- PMCID: PMC6622928
- DOI: 10.1523/JNEUROSCI.0702-11.2011
Item in Clipboard
Constructing realistic engrams: poststimulus activity of hippocampus and dorsal striatum predicts subsequent episodic memory
J Neurosci.
.
Abstract
Encoding of real-life episodic memory commonly involves integration of information as the episode unfolds. Offline processing immediately following event offset is expected to play a role in encoding the episode into memory. In this study, we examined whether distinct human brain activity time-locked to the offset of short narrative audiovisual episodes could predict subsequent memory for the gist of the episodes. We found that a set of brain regions, most prominently the bilateral hippocampus and the bilateral caudate nucleus, exhibit memory-predictive activity time-locked to the stimulus offset. We propose that offline activity in these regions reflects registration to memory of integrated episodes.
Figures
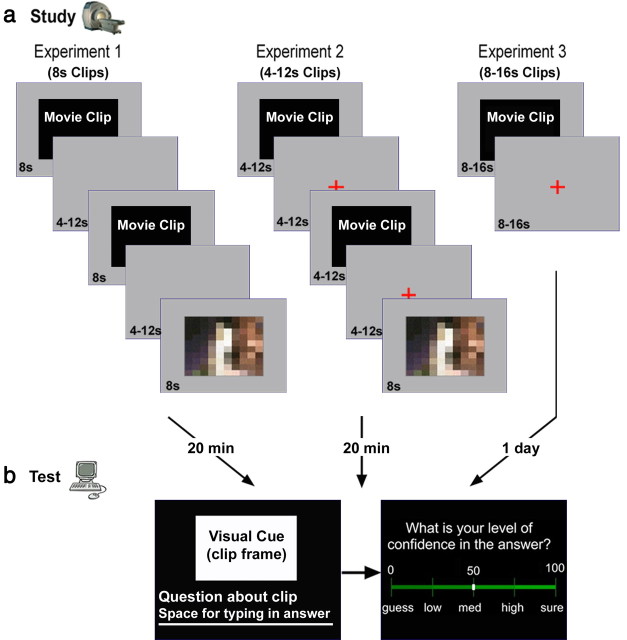
The experimental protocol. a, Study sessions of experiments 1–3. In all experiments, participants underwent brain fMRI scanning during the Study session. In experiments 1 and 2, participants viewed 160 Movie clips and 20 Scrambled clips, intermixed in random order. Movie clips were of fixed length (8 s) in experiment 1 and varying length (4–12 s) in experiment 2; all Scrambled clips were of fixed length (8 s). In experiment 3, participants viewed 112 Eventful clips of varying lengths (8 s/12 s/16 s) and 16 Uneventful clips, intermixed in random order. Before Study, participants were informed that they would subsequently be tested on the clips' gist. b, A Test session took place in a separate room, outside the scanner, 20 min (experiments 1 and 2) or 1 d (experiment 3) after Study. The Test session consisted of a computerized cued-recall test in Hebrew. One open-ended question was presented about each of the Movie clips, along with a still frame that served as a visual cue. Participants typed in their answers in the allotted space below the question. Following each question, participants estimated their degree of confidence in the previous answer, on a VAS ranging from 0 to 100.
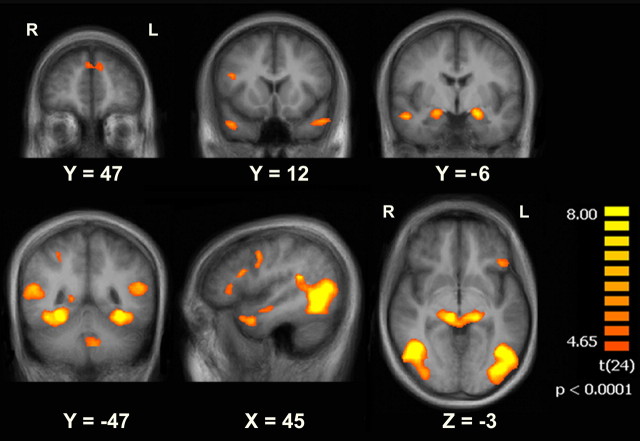
Brain regions showing intraclip activity correlated with subsequent memory. Regions showing significantly stronger BOLD activity for Remembered clips when compared with Forgotten clips (Early ROIs; p < 0.0001, uncorrected; minimal cluster size = five contiguous functional voxels; GLM with a random effects group analysis; n = 25). Data are shown on coronal, sagittal, and axial slices of the group-average brain.
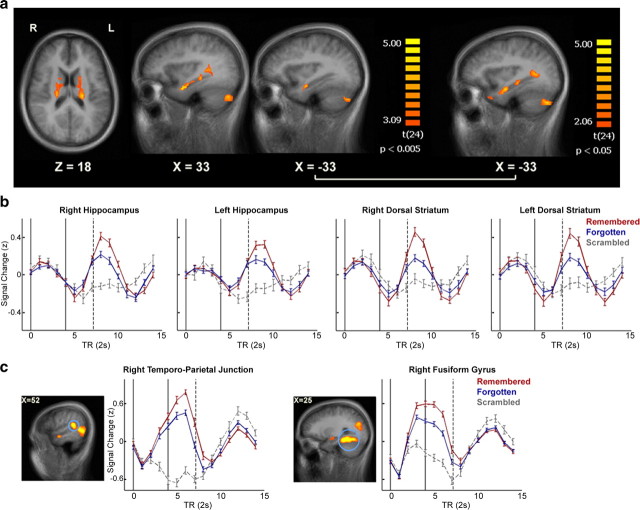
Brain regions showing postclip activity correlated with subsequent memory. a, Regions showing a significant difference in BOLD activity in experiment 1 between blank screens following Remembered clips (R-Blank) and blank screens following Forgotten clips (F-Blank) in conjunction with F-Blank > 0 (Delayed ROIs; p < 0.005 for each contrast, uncorrected; minimal cluster size = five contiguous functional voxels; GLM with a random effects group analysis; n = 25). Data are shown on axial and sagittal slices of the group-average brain. On the right, a slice including the left hippocampus is shown with the same contrast at a more relaxed threshold (p < 0.05). b, c, Mean group BOLD signal (after z scoring each time course) during and following Remembered, Forgotten, and Scrambled clips. Error bars indicate SEM. The black lines indicate the onset (left line) and offset (right line) of clip presentation, and the dashed line indicates the mean onset of the following clip. b, Results are shown for the bilateral hippocampus bodies and bilateral dorsal striatum (dorsal caudate nucleus). c, Results are shown for the right temporoparietal junction and the right fusiform gyrus, which display intraclip activity onset, for comparison.
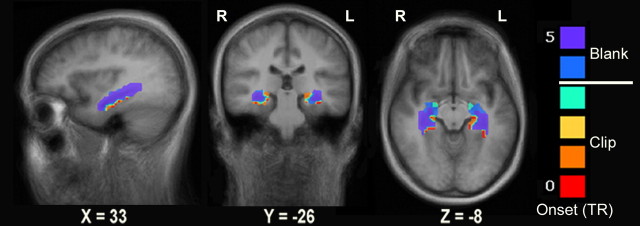
Distribution of BOLD response onset in the hippocampus. The onset of the average response to clip presentation (regardless of memorability, averaged over clips and participants) for each voxel in manually defined ROIs (based on the average group anatomy) encompassing the bilateral hippocampus. Data are shown on sagittal, coronal, and axial slices of the group-average brain. The onset is calculated in TRs (TR = 2 s) from the beginning of clip presentation (with clip onset at TR = 0 and blank onset at TR = 4). An estimated onset of TR = X in a given voxel corresponds to an initial rise in BOLD signal at TR = X (see Materials and Methods for onset calculation method).
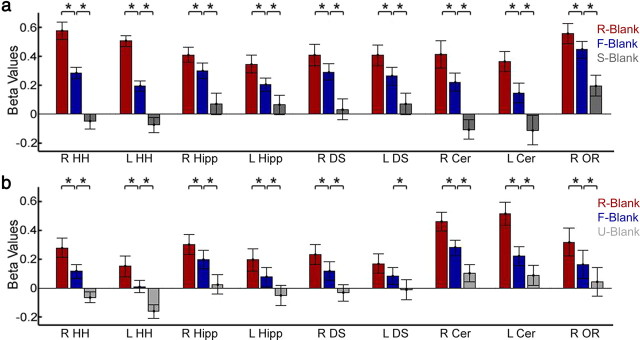
Delayed ROIs exhibit a DM effect regardless of clip length. a, Beta values of R-Blank, F-Blank, and S-Blank conditions in experiment 2 (for Delayed ROIs, derived from experiment 1). Contrasts of R-Blank > F-Blank, F-Blank > baseline, and F-Blank > S-Blank were all statistically significant in all ROIs (p < 0.05, corrected). b, Beta values of R-Blank, F-Blank, and U-Blank conditions in experiment 3 (for Delayed ROIs). A contrast of R-Blank > F-Blank was significant in all ROIs (p < 0.05, corrected, except the left caudate nucleus with p = 0.055) and a contrast of F-Blank > U-Blank was statistically significant in all ROIs (p < 0.05, corrected). Results are shown for all Delayed ROIs—bilateral hippocampal body (Hipp), bilateral hippocampus head (HH), right optic radiations (OR), bilateral dorsal striatum (DS), and bilateral cerebellum (Cer).
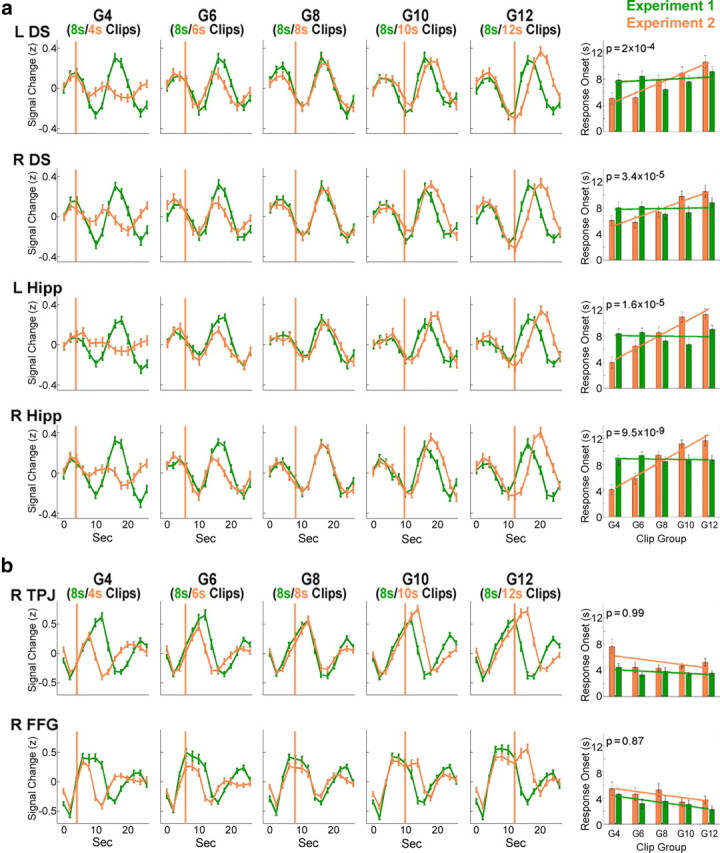
Correlation of BOLD response onset to clip length. Mean group BOLD signal (after z scoring each time course) during and following clips of each group (divided by length) in experiment 1 (all groups include 8 s clips, depicted in green) and in experiment 2 (each group includes clips of a different length, depicted in orange). Data include both Remembered and Forgotten clips, averaged from clip onset (time-point 0 represents clip onset). The orange lines represent the clip offset in experiment 2 (the clip offset in experiment 1 was always at 8 s). Error bars indicate SEM. The right column includes an automated determination of signal onset for each length group and a statistical comparison of the onset between experiments. The slope of the regression line (of response onset to clip group) in experiment 2 was compared with the slope in experiment 1 (one-tailed t test, corrected); the p values of the comparison are denoted. a, Results are shown for a subset of the Delayed ROIs—the bilateral hippocampus bodies (Hipp) and the bilateral dorsal striatum (DS). b, Results are shown for a subset of the Early ROIs—the right temporoparietal junction (TPJ) and the right fusiform gyrus (FFG).
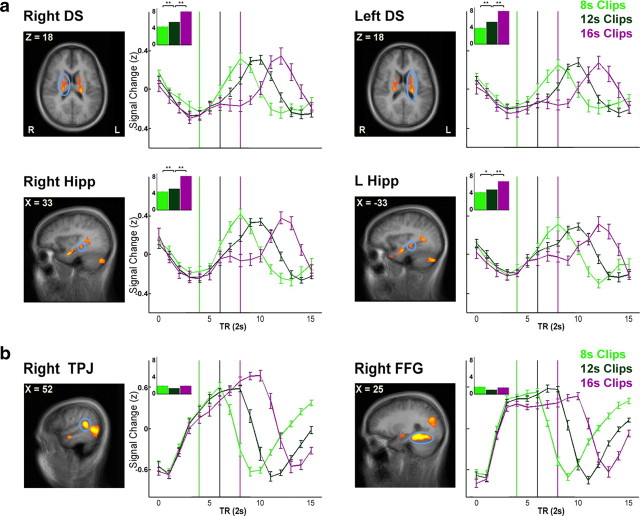
Differences in BOLD response onset as a function of clip offset. Mean group BOLD signal (after z scoring each time course) during and following 8 s, 12 s, and 16 s clips (data from experiment 3). Data include both Remembered and Forgotten clips averaged from clip onset (time-point 0 represents clip onset). Error bars indicate SEM. The light green, dark green, and purple lines indicate the clip offset (for 8 s, 12 s, and 16 s clips, respectively). The inset graphs show a statistical comparison of response onset between the three conditions (the y-axis depicts the response onset and the x-axis depicts the clip lengths). a, Results are shown for a subset of the Delayed ROIs—the bilateral hippocampus bodies (Right Hipp: F(2,205) = 29.3, p = 6 × 10⁻¹²; Left Hipp: F(2,205) = 11.9, p = 10−5) and the bilateral dorsal striatum (Right DS: F(2,205) = 29.7, p = 5 × 10⁻¹²; Left DS: F(2,205) = 33.2, p = 3 × 10⁻¹³). b, Results are shown for a subset of the Early ROIs—the right temporoparietal junction (Right TPJ: F(2,205) = 4, n.s.) and the right fusiform gyrus (Right FFG: F(2,205) = 3.1, n.s.).
References
-
- Axmacher N, Elger CE, Fell J. Ripples in the medial temporal lobe are relevant for human memory consolidation. Brain. 2008;131:1806–1817. - PubMed
-
- Baddeley A. The episodic buffer: a new component of working memory? Trends Cogn Sci. 2000;4:417–423. - PubMed
-
- Brewer JB, Zhao Z, Desmond JE, Glover GH, Gabrieli JD. Making memories: brain activity that predicts how well visual experience will be remembered. Science. 1998;281:1185–1187. - PubMed
-
- Buzsáki G. Two-stage model of memory trace formation: a role for “noisy” brain states. Neuroscience. 1989;31:551–570. - PubMed
Publication types
MeSH terms
Substances
LinkOut - more resources
Full Text Sources