. 2011 Jul 19;108(29):11756-65.
doi: 10.1073/pnas.1018098108. Epub 2011 Jun 15.

A haploid genetic screen identifies the major facilitator domain containing 2A (MFSD2A) transporter as a key mediator in the response to tunicamycin

Affiliations

A haploid genetic screen identifies the major facilitator domain containing 2A (MFSD2A) transporter as a key mediator in the response to tunicamycin

Jan H Reiling et al. Proc Natl Acad Sci U S A. .

Abstract

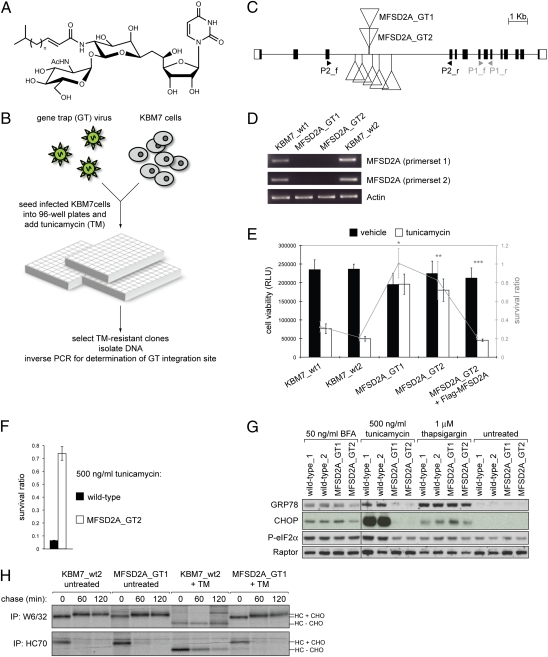
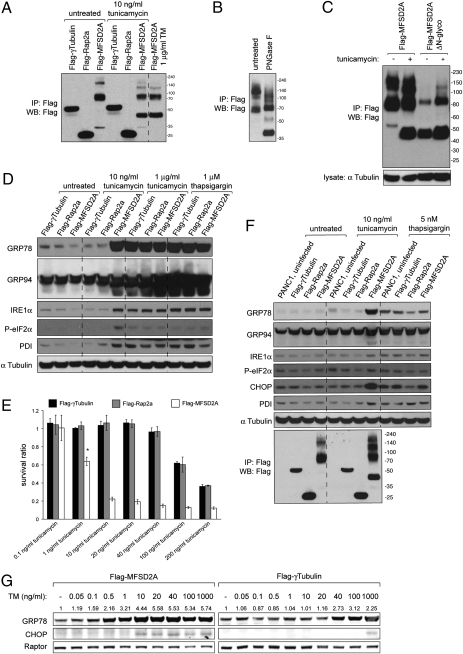
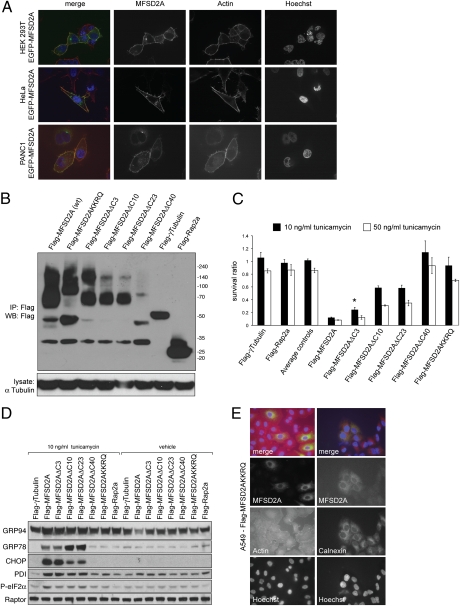
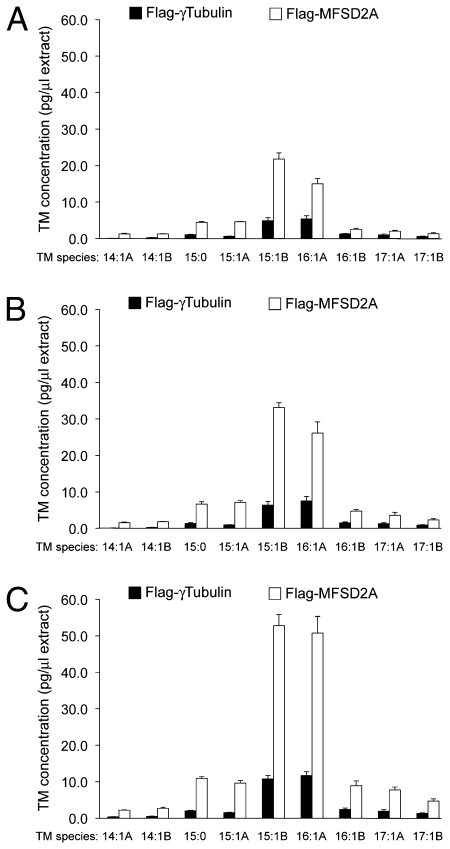
Tunicamycin (TM) inhibits eukaryotic asparagine-linked glycosylation, protein palmitoylation, ganglioside production, proteoglycan synthesis, 3-hydroxy-3-methylglutaryl coenzyme-A reductase activity, and cell wall biosynthesis in bacteria. Treatment of cells with TM elicits endoplasmic reticulum stress and activates the unfolded protein response. Although widely used in laboratory settings for many years, it is unknown how TM enters cells. Here, we identify in an unbiased genetic screen a transporter of the major facilitator superfamily, major facilitator domain containing 2A (MFSD2A), as a critical mediator of TM toxicity. Cells without MFSD2A are TM-resistant, whereas MFSD2A-overexpressing cells are hypersensitive. Hypersensitivity is associated with increased cellular TM uptake concomitant with an enhanced endoplasmic reticulum stress response. Furthermore, MFSD2A mutant analysis reveals an important function of the C terminus for correct intracellular localization and protein stability, and it identifies transmembrane helical amino acid residues essential for mediating TM sensitivity. Overall, our data uncover a critical role for MFSD2A by acting as a putative TM transporter at the plasma membrane.


Conflict of interest statement

The authors declare no conflict of interest.

Figures

Fig. 1.
Fig. 1.
Cells without MFSD2A are resistant to TM. (A) Structure of TM. TM is a mixture of homologous nucleotide sugar analogs differing in length (13–17 carbon atoms), branching, and unsaturation of their fatty acyl chain (n = 8–11). For simplicity, only one TM isomer type is shown. (B) Outline of the TM-resistance screen in the haploid KBM7 cell line. Details are given in the text. (C) Genomic locus of MFSD2A and GT insertions (triangles) found in the screen. White boxes denote the 5′ and 3′ untranslated regions, and black boxes denote coding exons. Arrowheads indicate primer binding sites of primersets 1 and 2 used for semiquantitative RT-PCR analysis (also in D). f, forward primer; r, reverse primer. (D) RT-PCR analysis of MFSD2A_GT1, MFSD2A_GT2, and WT KBM7 cells reveals no remaining MFSD2A mRNA in the GT lines using two different MFSD2A primer pairs. (E) MFSD2A GT1 (*P < 3 × 10⁻⁹) and MFSD2A GT2 (**P < 2 × 10⁻⁶) cells are significantly more resistant to TM compared with WT KBM7 cells (survival ratios of wt1 and wt2 were combined for Student two-tailed t test). Lentiviral introduction of a Flag-tagged MFSD2A cDNA construct into MFSD2A GT KBM7 cells restores the TM sensitivity phenotype comparable with that of WT cells (***P < 1.4 × 10⁻⁶; comparison between MFSD2A GT2 vs. MFSD2A GT2+Flag-MFSD2A). KBM7 cells were seeded into 96-well plates and grown for 40 h in the presence or absence of 500 ng/mL TM. Cell viability was determined using the CellTiter Glo (CTG) assay by comparing TM-treated with untreated wells (Materials and Methods). RLU, relative luminescence units. (F) MFSD2A_GT2 or WT KBM7 cells were grown in 96-well plates for 5 d in the presence or absence of 500 ng/mL TM, and cell survival was determined with the CTG assay. MFSD2A GT2 cells show a highly significant enhanced TM resistance (P < 10−8). The survival ratio was calculated by dividing the mean values for treated cells by the untreated control values. Bars display survival ratio means ± SD of 11 wells for each condition. (G) Western blot analysis of two independent WT and MFSD2A GT KBM7 lines treated for 8 h with ER stress-inducing reagents before cell lysis. UPR signaling was assessed by immunoblotting with antibodies against different ER stress markers. The BFA-treated samples were run on a gel separate from the remaining lysates. (H) WT and MFSD2A GT1 KBM7 cells were labeled for 15 min with 35S methionine, chased for the indicated time points in the presence or absence of TM, and lysed in 1% SDS before IP with indicated antibodies. HC + CHO, glycosylated class I MHC heavy chains; HC − CHO, deglycosylated class I MHC heavy chains.
Fig. 2.
Fig. 2.
MFSD2A glycosylation and effects of MFSD2A overexpression. (A) Stable A549 cells generated by lentivirus infection that overexpress the indicated proteins were grown for 24 h in the presence or absence of TM before cell lysis. The proteins were Flag affinity-purified, and immunoprecipitates were analyzed by SDS/PAGE followed by Western blotting. (B) Immunopurified MFSD2A was subjected to PNGase F digest and analyzed by SDS/PAGE and immunoblotting with anti-Flag antibody. (C) Stable Flag-MFSD2A– and Flag-MFSD2AΔN-glyco–expressing A549 cells were treated with 1 μg/mL TM for 24 h or left untreated. After cell lysis, Flag-purified MFSD2A or MFSD2AΔN-glcyo were subjected to Western blot analysis as described. (D) Stable A549 overexpressor lines mentioned in A were treated for 20 h with TM or thapsigargin. Lysates were analyzed by immunoblotting and probed with indicated antibodies. (E) The same overexpression lines described in A and D were subjected to chronic TM exposure. Flag-MFSD2A overexpressing cells are hypersensitive to TM [*P < 0.001 for 1 ng/mL TM and P < 1.5 × 10⁻⁶ (Student two-tailed t test) for the remaining higher TM concentrations; controls were pooled for statistical analysis]. Stable A549 cells were seeded into six-well plates (triplicate wells for each condition); 24 h after cell seeding, the culture media was replaced with fresh DMEM containing the indicated TM concentrations, and cell numbers were counted after additional 3 d ± TM with an automated Coulter Counter. Survival ratio was calculated from the number of surviving cells treated with TM divided by cell numbers of the untreated samples of the same genotype. (F) PANC1 cells stably expressing the indicated proteins were treated for 30 h with TM or thapsigargin, and lysates were analyzed by immunoblotting with antibodies shown. (G) TM dose-response analysis of stable A549 cells expressing Flag-MFSD2A (Left) or Flag-γ-Tubulin (Right; control) and treated with TM for 29 h. Values above GRP78 blots indicate the normalized GRP78 expression relative to Raptor levels. Blots were simultaneously processed and scanned using the Odyssey infrared imaging system (LI-COR). Quantitation of GRP78 expression was done by integrating pixel intensity of a defined rectangular area for each GRP78 protein band divided by the corresponding measurement for the Raptor control using Odyssey application software.
Fig. 3.
Fig. 3.
MFSD2A localization and overexpression effects of MFSD2A mutants. (A) IF confocal microscopy of transiently transfected HEK293T (Top), stable HeLa (Middle), or stable PANC1 cells (Lower), all expressing EGFP-MFSD2A, reveals MFSD2A localization at the plasma membrane. Phalloidin and Hoechst were used to visualize the Actin cytoskeleton and nuclei, respectively. (B) SDS/PAGE followed by Western blot analysis of Flag-immunopurified MFSD2A mutants and control proteins from stable A549 cells. (C) Stable polyclonal A549 cell lines were established by lentiviral infection with MFSD2A C-terminal deletion mutants or the ER-targeted MFSD2A form (MFSD2AKKRQ; also in E) and tested for their ability to mediate TM sensitivity. All C-terminal MFSD2A mutant constructs shown are significantly less potent to induce apoptosis in conjunction with 10 ng/mL TM treatment than WT MFSD2A (*P < 0.02; P values for the remaining C-terminal mutants are all significant as well; i.e., P < 0.01). Cells were grown for 3 d in media with 10 or 50 ng/mL TM. Bars and error bars represent the mean ± SD of triplicate wells. (D) Immunoblot analysis of cell extracts from stable lines described in B and C treated for 30 h with TM or vehicle. (E) IF staining for Flag and Actin of A549 cells stably expressing Flag-MFSD2AKKRQ (Left). MFSD2A was visualized with an antibody against the Flag epitope. Costaining of MFSD2AKKRQ with the ER marker Calnexin shows overlapping staining patterns (Right).
Fig. 4.
Fig. 4.
Increased TM accumulation in cells overexpressing MFSD2A. 500 ng/mL TM treatment for 0.5 (A), 1 (B), or 3 h (C) shows a significantly enhanced and time-dependent TM accumulation in stable A549 Flag-MFSD2A overexpression cells compared with controls (P < 0.03 for all TM species and time points shown using Student two-tailed t test). A and B TM species nomenclature refers to geometric or positional isomers as suggested by Tsvetanova et al. (1). Total TM content of lysates was analyzed by MS (details in Materials and Methods). Values are the normalized mean concentration ± SD (n = 3).

Comment in

  • Knocking out the door to tunicamycin entry.
    Bassik MC, Kampmann M. Bassik MC, et al. Proc Natl Acad Sci U S A. 2011 Jul 19;108(29):11731-2. doi: 10.1073/pnas.1109035108. Epub 2011 Jul 6. Proc Natl Acad Sci U S A. 2011. PMID: 21734150 Free PMC article. No abstract available.

References

    1. Tsvetanova BC, Kiemle DJ, Price NP. Biosynthesis of tunicamycin and metabolic origin of the 11-carbon dialdose sugar, tunicamine. J Biol Chem. 2002;277:35289–35296. - PubMed
    1. Takatsuki A, Tamura G. Effect of tunicamycin on the synthesis of macromolecules in cultures of chick embryo fibroblasts infected with Newcastle disease virus. J Antibiot (Tokyo) 1971;24:785–794. - PubMed
    1. Leavitt R, Schlesinger S, Kornfeld S. Tunicamycin inhibits glycosylation and multiplication of Sindbis and vesicular stomatitis viruses. J Virol. 1977;21:375–385. - PMC - PubMed
    1. Heifetz A, Keenan RW, Elbein AD. Mechanism of action of tunicamycin on the UDP-GlcNAc:dolichyl-phosphate Glc-NAc-1-phosphate transferase. Biochemistry. 1979;18:2186–2192. - PubMed
    1. Keller RK, Boon DY, Crum FC. N-acetylglucosamine-1-phosphate transferase from hen oviduct: Solubilization, characterization, and inhibition by tunicamycin. Biochemistry. 1979;18:3946–3952. - PubMed

Publication types