

Review
doi: 10.1038/nrc3081.
Dynamic modelling of oestrogen signalling and cell fate in breast cancer cells
Affiliations
- PMID: 21677677
- PMCID: PMC3294292
- DOI: 10.1038/nrc3081
Item in Clipboard
Review
Dynamic modelling of oestrogen signalling and cell fate in breast cancer cells
Nat Rev Cancer.
.
Abstract
Cancers of the breast and other tissues arise from aberrant decision-making by cells regarding their survival or death, proliferation or quiescence, damage repair or bypass. These decisions are made by molecular signalling networks that process information from outside and from within the breast cancer cell and initiate responses that determine the cell's survival and reproduction. Because the molecular logic of these circuits is difficult to comprehend by intuitive reasoning alone, we present some preliminary mathematical models of the basic decision circuits in breast cancer cells that may aid our understanding of their susceptibility or resistance to endocrine therapy.
Figures
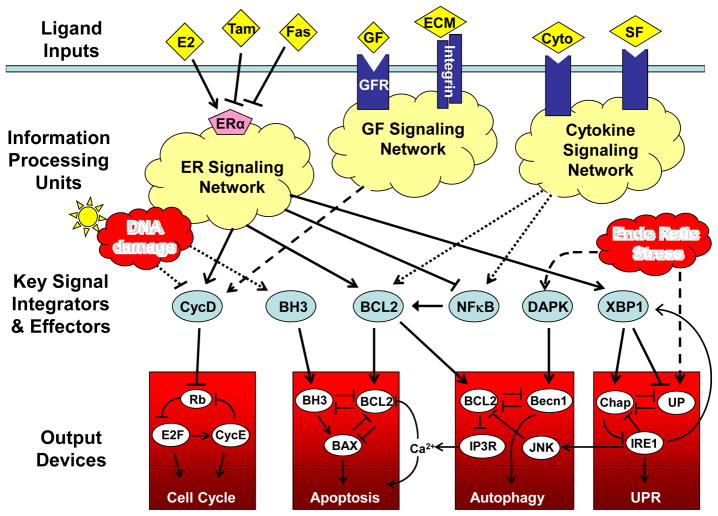
Extracellular signals, such as estrogen (E2), growth factors (GF), survival factors (SF), cytokines (cyto) and extracellular matrix (ECM), bind to receptor proteins, which initiate a complex series of chemical reactions within the cell, culminating ultimately in the activation of a set of integrator/effector proteins. These proteins sum up the positive and negative signals coming from the information processing units, and then they drive responses in the downstream decision modules and stress modules. The ‘cell cycle module’ coordinates DNA synthesis and mitotic cell division with cell growth and the body’s need for a continuous supply of new cells in the right place at the right time. The ‘apoptosis module’ rids the body of damaged, worn out, or un-needed cells. The ‘unfolded protein module’ is a response to stresses such as starvation and reactive oxygen species. Under conditions of extreme stress, the ‘autophagy module’ can provide the cell with a supply of energy and raw materials. Tamoxifen (Tam) and Faslodex (Fas) are inhibitors of the estrogen receptor (ERα), and they are commonly used to kill estrogen-dependent breast cancer cells.

a | Wiring diagram. Cyclin E-dependent kinase (CycE) promotes the transition of mammalian cells from G1 phase of the cell cycle into S phase. Quiescent cells are arrested in G1 by the retinoblastoma protein (RB), which binds to and inhibits E2F, a family of transcription factors, some of which can promote CYCE gene expression. Phosphorylation of RB by cyclin-dependent kinases compromises its inhibitory effect on E2Fs. The initial phosphorylation of RB is accomplished by cyclin D-dependent kinase (CYCD). After the G1/S transition is made, RB is maintained in its inactive (phosphorylated) form by CYCE and by cyclin A- and B-dependent kinases that are active in S-G2-M. Quiescent cells, which have very little CYCD, can be induced to proliferate by transcription factors (such as Myc, Fos, Jun) that are upregulated by growth factors in serum. These transcription factors promote the expression of both CYCD and E2F genes, and E2F proteins upregulate their own transcription. b | Signal-response curve. The wiring diagram in panel a is converted into a set of nonlinear differential equations (supplementary information S1 (Box)), and the steady-state levels of CYCD and E2F are plotted as functions of serum concentration in the growth medium. Although CYCD level increases smoothly with serum concentration (‘rheostat’), the E2F distribution exhibits a bimodal dependence on serum concentration (‘toggle switch’),. c and d | Experimental verification in rat embryonic fibroblasts (REF cells); from Yao et al., used by permission. Red curves: serum concentration is raised from 0 to final percentage. Green curves: serum concentration is raised to 20% for 5 hours, then lowered to final percentage. GFP fluorescence is driven by an E2F promoter (left) or a CYCD promoter (right). Histograms of CYCD expression shift smoothly up-and-down with final serum percentage. E2F histograms show a bimodal dependence on final serum percentage between ~0.2% and 2%. Notice a distinct hysteresis effect in the E2F response: on shifting serum up (red curves), bistability is not observed until serum level exceeds ~1%, but on shifting serum down (green curves), bistability is maintained to serum levels < 0.2%.
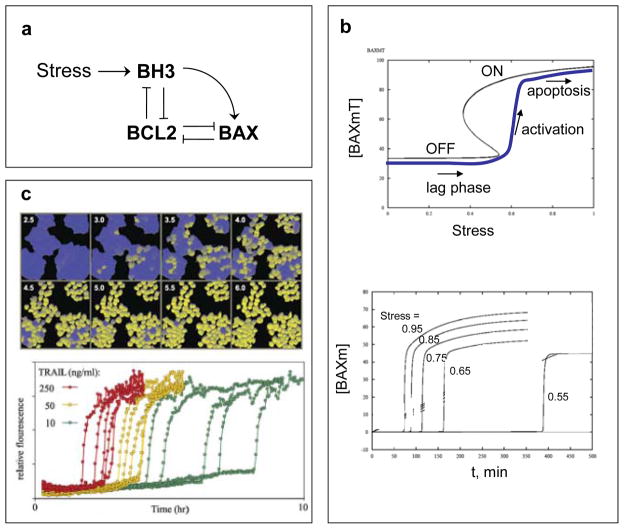
a | Wiring diagram. Programmed cell death is triggered by activation of BAX proteins in the outer membrane of mitochondria. Active BAX causes the membrane to become permeable to proteins, such as cyctochrome C and SMAC, which induce the activation of proteases (caspases) and other hydrolytic enzymes that disassemble the macromolecules of the cell. BAX is activated by BH3-family proteins and kept inactive by binding to BCL-family proteins. BH3 proteins also bind to BCL proteins. b | Signal-response curve. A mathematical model of the wiring diagram is presented in supplementary information S2 (Box). Top: steady-state concentration (black curve) of total membrane-bound BAX, [BAXm]T = [BAXm] + [BAXm:BCL2], as a function of [Stress]. For intermediate levels of Stress, the network has two stable steady states: an OFF state with low total level of BAXm, all of it complexed to BCL2 (i.e., [BAXm] ≈ 0); and an ON state with high total level of BAXm, most of it un-complexed to BCL2 (i.e., [BAXm] ≈ [BAXm]T). Bottom: time-course of active BAX. Each simulation is started in the naïve state: no stress, low level of BH3, [BAXm] ≈ 0. At t = 0, [Stress] is raised to a final value that varies (from one simulation to the next) from 0.55 to 0.95. The time-course for final [Stress] = 0.95 is plotted as the blue curve on the upper graph. Notice that, in each simulation, there is a long lag time followed by an abrupt activation of BAX (and subsequently an irreversible activation of caspases). The duration of the lag phase is a decreasing function of [Stress]. c | Experimental verification in HeLa cells (cervical cancer cell line); from Albeck et al., used by permission. Top: Cells are treated with 50 ng/ml TRAIL (TNF-related apoptosis-inducing ligand) and assayed for caspase activity by cleavage of an artificial substrate manufactured by the cell. Cells with high caspase activity are pseudo-colored yellow. Notice the long lag time before caspases are activated in any cells, then individual cells activate caspases abruptly, but there is a wide dispersion of activation times among cells. Bottom: traces of caspase activity in single cells activated by different concentrations of TRAIL.

a | Wiring diagram. In response to stress, both Beclin-1 and BCL2 are phosphorylated, causing the BCL2:Beclin-1 complex to dissociate,. Beclin-1 is phosphorylated by DAPK (death-associated protein kinase), and BCL2 is phosphorylated by JNK, a downstream target of the IRE1 arm of the UPR,,. Detachment from the extracellular matrix provides an additional stress to the cells. Free Beclin-1 participates (with other components, such as Atg8/LC3) in initiating autophagy. Autophagy can suppress the stress signal by providing the cell with ATP and raw materials for new protein synthesis. BCL2 phosphorylation also allows the inositol trisphosphate receptor (IP3R) to release calcium from the endoplasmic reticulum to the cytoplasm,. If the concentration of calcium in the cytoplasm gets large enough, apoptosis is triggered. Activated caspases cleave Beclin-1 and turn off autophagy. Hence, under low stress conditions, autophagy promotes cell survival; at moderate stress, it may lead to autophagic cell death; and for large stress, calcium release may stimulate apoptosis by the intrinsic (mitochondrial) pathway. b | Numerical simulations. The wiring diagram is converted into a set of ordinary differential equations (supplementary information S3 (Box)), and the fraction of cells predicted to stain positive for autophagic vesicles is plotted as a function of time. 1) Detached and high stress; 2) attached and moderate stress; 3) detached and no stress. c, d | Experimental evidence in MCF-7 cells (breast cancer cell line); from Petrovski et al., used by permission. Panel c: Percentage of cells that have taken up monodansylcadaverin (MDC) into autophagic vacuoles on days 1—7 after the following treatments: (▽) 10% fetal calf serum (FCS) on poly-HEMA coated plates; non-adherent cells undergo autophagy by day 6 and later die by apoptosis (not shown). (▼) 3% charcoal-stripped FCS on poly-HEMA plates; estrogen-depleted, non-adherent cells undergo autophagy by day 4 and later die by apoptosis. (○) 3% charcoal-stripped FCS + Tamoxifen; estrogen-depleted, ER-inhibited cells undergo autophagy by day 4. (□) 3% charcoal-stripped FCS + Tamoxifen on poly-HEMA plates; estrogen-depleted, ER-inhibited, non-adherent cells undergo autophagy by day 2 and later die by apoptosis. Panel d (top): Transmission electron microscopy of (1) untreated, control cells and of (2) autophagic cells (○) on day 4, showing numerous autophagic vacuoles (white) in the cytoplasm. Panel d (bottom): Western blot analysis of LC3 expression in autophagic cells (○) on days 0—7; c = positive control.
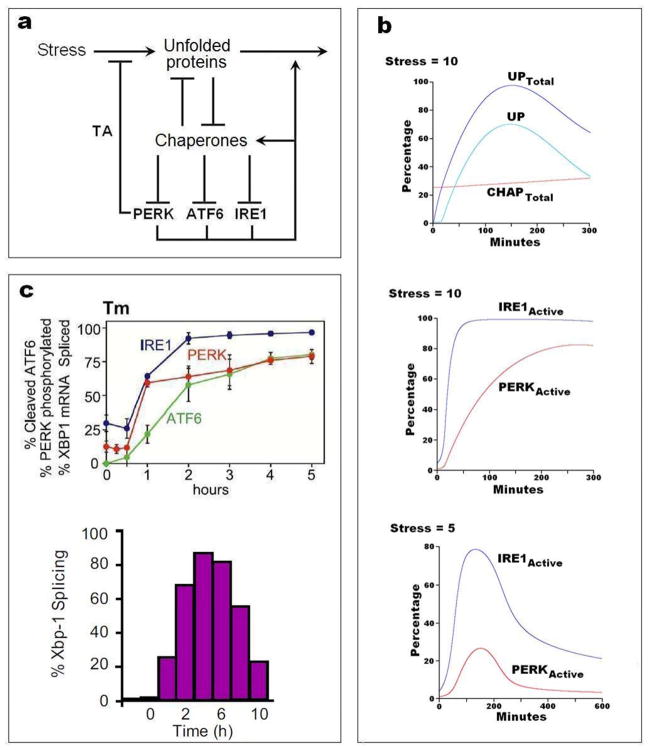
a | Wiring diagram. The unfolded protein response (UPR) is a coordinated cellular program that is induced by the accumulation of unfolded and misfolded proteins in the lumen of the endoplasmic reticulum. Elevated levels of unfolded/misfolded proteins are brought down by chaperones, foldases, oxidoreductases, glycosylases and proteases (we refer to all these components simply as chaperones). As unfolded proteins pull chaperones away from the lumenal domains of PERK, ATF6, and IRE1, then these three proteins up-regulate the expression of certain genes that reduce the stress and increase the protein folding capacity of the endoplasmic reticulum. TA = translation attenuation. b | Numerical simulations computed from the mathematical model in supplementary information S4 (Box). Top and middle: at t = 0, with the model at a stable resting state, a stress of 10 (arbitrary units) is added to the differential equations, and the response of the system is plotted in terms of total unfolded protein, total chaperone, and protein species not bound to chaperones (UP, IRE1active and PERKactive). Bottom: response to a stress of 5 a.u. applied at t = 0. c | Experimental verification in non-cancerous cells. Top: Time courses of the three stress sensors after treatment of CHO (chinese hamster ovary) cells with 10 μg/mL of tunicamycin (Tm) to induce protein misfolding; from DuRose et al., used by permission. Bottom: Time course of IRE1 activity (assayed as % splicing of XBP1 mRNA) in HEK293 (human embryonic kidney) cells treated with 5 μg/mL of tunicamycin; from Li et al., used by permission.

a | Wiring diagram. E2 = estrogen, ER = estrogen receptor alpha, GF = growth factors, GFR = growth factor receptors. GFR and its downstream signaling network are suppressed by ligand-dependent ER signaling (‘ER classic’) but promoted by ligand-independent ER signaling (‘ER non-classic’). Increased GF signaling after E2 withdrawal can shift ER from classical to non-classical signaling. GF signaling can up-regulate its own activity. b | Signal-response curve. Differential equations describing the wiring diagram are provided in supplementary information S5 (Box). The steady-state activity of GFR is plotted as a function of [E2] in the growth medium (from 0 to 5 pM). At any given [E2] in this range, a cell may express a low or high level of GFR (upper and lower solid lines; the middle dotted line indicates a branch of unstable steady states). c | Experimental evidence; from Liu et al., modified and used by permission. Bimodal distribution of HER2 (ErbB-2) expression in a monoclonal culture of HER2-overexpressing MCF-7 cells. The bimodal distribution pattern is induced by a change in [E2]. Cells grown on charcoal-stripped calf serum (CCS) for 5 weeks or longer are depleted of E2 and constitute a single population of high HER2-expressing cells by flow-cytometric analysis (top plot, abundance of HER2 as detected by fluorescent antibody). Replacing CCS with FCS (fetal calf serum, containing E2) leads to the emergence over time (5 weeks, 3 months, 4 months) of a second population of low HER2-expressing cells. Similar results have also been observed in EGFR (ErbB-1)-overexpressing MCF-7 cells. d | Model simulation. In supplementary information S5 (Box), noise terms are added to the differential equations to take stochastic effects into account. 2000 cells are simulated with [E2] = 0 (corresponding to CCS) for 3.3 weeks, which results in a single population of high HER2-expressing cells (top plot). Setting [E2] = 5 pM (corresponding to FCS) leads to a time-course of HER2 expression histograms similar to the experimental observations in panel c.
References
-
- Hanahan D, Weinberg, Robert A. Hallmarks of Cancer: The Next Generation. Cell. 2011;144:646–674. - PubMed
-
- Hornberg JJ, Bruggeman FJ, Westerhoff HV, Lankelma J. Cancer: a Systems Biology disease. Biosystems. 2006;83:81–90. - PubMed
-
- Faratian D, Moodie SL, Harrison DJ, Goryanin I. Dynamic computational modeling in the search for better breast cancer drug therapy. Pharmacogenomics. 2007;8:1757–61. - PubMed
-
- Novak B, Pataki Z, Ciliberto A, Tyson JJ. Mathematical model of the cell division cycle of fission yeast. Chaos. 2001;11:277–286. - PubMed
Publication types
MeSH terms
Substances
Grants and funding
LinkOut - more resources
Full Text Sources
Other Literature Sources
Medical
