. 2012 Jan;6(1):183-94.
doi: 10.1038/ismej.2011.74. Epub 2011 Jun 16.

Illumina-based analysis of microbial community diversity

Affiliations

Illumina-based analysis of microbial community diversity

Patrick H Degnan et al. ISME J. 2012 Jan.

Abstract

Microbes commonly exist in milieus of varying complexity and diversity. Although cultivation-based techniques have been unable to accurately capture the true diversity within microbial communities, these deficiencies have been overcome by applying molecular approaches that target the universally conserved 16S ribosomal RNA gene. The recent application of 454 pyrosequencing to simultaneously sequence thousands of 16S rDNA sequences (pyrotags) has revolutionized the characterization of complex microbial communities. To date, studies based on 454 pyrotags have dominated the field, but sequencing platforms that generate many more sequence reads at much lower costs have been developed. Here, we use the Illumina sequencing platform to design a strategy for 16S amplicon analysis (iTags), and assess its generality, practicality and potential complications. We fabricated and sequenced paired-end libraries of amplified hyper-variable 16S rDNA fragments from sets of samples that varied in their contents, ranging from a single bacterium to highly complex communities. We adopted an approach that allowed us to evaluate several potential sources of errors, including sequencing artifacts, amplification biases, non-corresponding paired-end reads and mistakes in taxonomic classification. By considering each source of error, we delineate ways to make biologically relevant and robust conclusions from the millions of sequencing reads that can be readily generated by this technology.


Figures
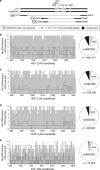
Figure 1
Figure 1
iTag design and diversity in E. coli. (a) Three primer combinations were tested mapping to ≈100- or ≈160-bp regions spanning the V6 loop of bacterial 16S rRNA. The schematic representation illustrates the two alleles (black bars differing at nine positions) in the 16S rRNA genes of E. coli MG1655 (rrsA-H) that are differentiated by the resulting amplicons (LV6, S1V6 and S2V6, with forward and reverse primer positions designated). In panels (be), the location and count of high-quality, 100% OTUs with single sequencing errors relative to the expected E. coli reference alleles are plotted for each of four E. coli iTag samples. The dashed and solid lines indicate the numbers of mutations after application of increasingly stringent sequence abundance thresholds (10−4, 10−3, 10−2) used to remove erroneous OTUs. The pie charts indicate the relative abundance of iTags corresponding to expected E. coli OTUs (white), tags with 1-bp errors (gray) and putative contaminants (black) without the application of an abundance threshold.
Figure 2
Figure 2
The thresholds required to attain the actual rRNA diversity in a sample. Observed species estimates (OTUs) at 100% (filled) and 97% (open) levels are plotted at a series of sequence abundance thresholds for (a) E. coli and (b) 19 Strain samples. The solid and dashed lines represent the expected numbers of OTUs at 100% and 97% identity thresholds, respectively. An identical pattern emerges when the numbers of estimated species (Chao1) are used (data not shown).
Figure 3
Figure 3
Frequencies of OTUs from defined communities. The stacked bar (left) indicates the expected frequencies of each of the 19 species based on input DNA, followed by the frequencies obtained in each of three iTag analyses. The abbreviations are as follows: X., Xylella; S., Salmonella; E., Escherichia; A., Agrobacterium; Strep., Streptococcus; Staph., Staphylococcus; B., Bacillus.
Figure 4
Figure 4
iTag diversity and taxonomic representation in the colon of house mouse. (a) The pie charts indicate the relative abundances and taxonomic affiliation of the resultant OTUs based on the RDP Classifier labeled according to the key. The plot shows the numbers of OTUs after application of different abundance and clustering thresholds on the 100% OTUs derived for the M. domesticus WSB samples GCA–S1V6 and TCC–S2V6. (b) The numbers of phylotypes common to the 100% OTUs predicted at three increasingly stringent sequence abundance thresholds (10−4, 10−3, 10−2).

References

    1. Antonopoulos DA, Huse SM, Morrison HG, Schmidt TM, Sogin ML, Young VB. Reproducible community dynamics of the gastrointestinal microbiota following antibiotic perturbation. Infect Immun. 2009;77:2367–2375. - PMC - PubMed
    1. Blattner FR, Plunkett G, III, Bloch CA, Perna NT, Burland V, Riley M, et al. The complete genome sequence of Escherichia coli K-12. Science. 1997;277:1453–1462. - PubMed
    1. Bowers RM, Lauber CL, Wiedinmyer C, Hamady M, Hallar AG, Fall R, et al. Characterization of airborne microbial communities at a high-elevation site and their potential to act as atmospheric ice nuclei. Appl Environ Microbiol. 2009;75:5121–5130. - PMC - PubMed
    1. Caporaso JG, Lauber CL, Walters WA, Berg-Lyons D, Lozupone CA, Turnbaugh PJ, et al. Global patterns of 16S rRNA diversity at a depth of millions of sequences per sample. Proc Natl Acad Sci USA. 2011;108 (Suppl 1:4516–4522. - PMC - PubMed
    1. Cardenas E, Wu WM, Leigh MB, Carley J, Carroll S, Gentry T, et al. A combined massively parallel sequencing—indicator species approach revealed significant association between sulfate-reducing bacteria and uranium-reducing microbial communities. Appl Environ Microbiol. 2010;76:6778–6786. - PMC - PubMed

Publication types