. 2011 May 21;13(19):8953-60.
doi: 10.1039/c0cp02908d.

Effects of electrode surface modification with chlorotoxin on patterning single glioma cells

Affiliations

Effects of electrode surface modification with chlorotoxin on patterning single glioma cells

Fareid Asphahani et al. Phys Chem Chem Phys. .

Abstract

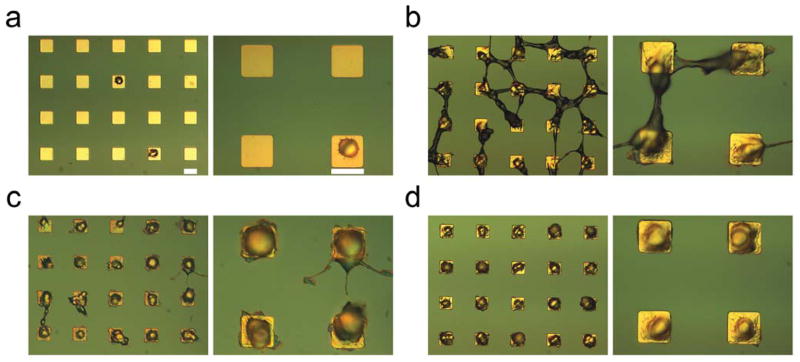
A microchip patterned with arrays of single cancer cells can be an effective platform for the study of tumor biology, medical diagnostics, and drug screening. However, patterning and retaining viable single cancer cells on defined sites of the microarray can be challenging. In this study we used a tumor cell-specific peptide, chlorotoxin (CTX), to mediate glioma cell adhesion on arrays of gold microelectrodes and investigated the effects of three surface modification schemes for conjugation of CTX to the microelectrodes on single cell patterning, which include physical adsorption, covalent bonding mediated by N-hydroxysuccinimide (NHS), and covalent bonding via crosslinking succinimidyl iodoacetate and Traut's (SIA-Traut) reagents. The CTX immobilization to microelectrodes was confirmed by high-resolution X-ray photoelectron spectroscopy. Physically adsorbed CTX showed better support for cell adhesion and is more effective in confining adhered cells on the electrodes than covalently-bound CTX. Furthermore, cell adhesion and spreading on microelectrodes were quantified in real-time by impedance measurements, which revealed an impedance signal from physically adsorbed CTX electrodes four times greater than the signal from covalently-bound CTX electrodes.


Figures

Fig. 1
Fig. 1
Illustration of surface modification of gold electrodes with CTX by three conjugation methods: (a) covalent bonding mediated by NHS (Cov1), (b) covalent bonding mediated by SIA-Traut (Cov2), and (c) physical adsorption (PA).
Fig. 2
Fig. 2
High resolution XPS scans of carbon peaks for CTX on gold electrodes immobilized by (a) Cov1, (b) Cov2, and (c) PA schemes. Black dots represent the acquired spectral data from each sample. The black waveform represents the fitted curve based on the individual bonding peaks C=O (blue), C–O/C–N (green), and C–C/C–H (red).
Fig. 3
Fig. 3
(a) Comparison of N1s high-resolution scans with fitted N–C (green) and N–O (blue) bonding peaks for Cov1 binding scheme without CTX (labeled “NHS”, bottom) and Cov1 scheme with CTX (labeled “Cov1”, top). Black dots represent the acquired spectral data, and the black waveform represents the fitted peak for each sample. (b) Comparison of high resolution scans of I3d3 peak for Cov2 scheme with CTX (labeled “Cov2”, black) and without CTX (labeled “SIA”, red), where both waveforms represent the acquired spectral data.
Fig. 4
Fig. 4
Quantitative cell adhesion analyses using Alamar Blue assay for 9L cells 24 hr after seeding on gold substrates modified without CTX and with CTX through Cov1, Cov2, and physically adsorption schemes.
Fig. 5
Fig. 5
Optical DIC micrographs of 9L single-cell patterning 24 hr after seeding on 20 μm square gold electrodes modified with (a) no CTX (control), (b) covalently-bound CTX using NHS intermediary chemical scheme, (c) covalently-bound CTX using SIA-Traut intermediary chemical scheme, and (d) physically adsorbed CTX. In each panel, the right image is zoomed. The scale bars are 20 μm in all images, and spacing between the electrodes is 40 μm.
Fig. 6
Fig. 6
Optical DIC micrographs of 9L single-cell patterned 24 hr after seeding on CTX-modified electrodes, through physical adsorption, of (a) 10 μm, (b) 15 μm, and (c) 20 μm sizes. In each panel, the right image is zoomed. The scale bars are 20 μm in all images, and spacing between the electrodes is 40 μm.
Fig. 7
Fig. 7
(a) Normalized real impedance waveforms of three 9L cell on PA, Cov1, and Cov2 CTX-modified 30 μm electrodes, respectively, monitored over a period of 44 h. (b) Averaged values of normalized single-cell real impedance (n = 10) for cells on the three substrates described in (a). Real impedance was normalized to the impedance prior to cell seeding.

References

    1. Hanash SM, Pitteri SJ, Faca VM. Nature. 2008;452:571–579. - PubMed
    1. Levsky JM, Singer RH. Trends Cell Biol. 2003;13:4–6. - PubMed
    1. Asphahani F, Zhang M. Analyst. 2007;132:835–841. - PMC - PubMed
    1. Luong JHT. Analytical Letters. 2003;36:3147–3164.
    1. Kovacs GTA. Proceedings Of The Ieee. 2003;91:915–929.

Publication types