. 2011 Sep 1;70(5):487-95.
doi: 10.1016/j.biopsych.2011.04.021. Epub 2011 Jun 15.

FosB is essential for the enhancement of stress tolerance and antagonizes locomotor sensitization by ΔFosB

Affiliations

FosB is essential for the enhancement of stress tolerance and antagonizes locomotor sensitization by ΔFosB

Yoshinori N Ohnishi et al. Biol Psychiatry. .

Erratum in

  • Biol Psychiatry. 2012 Sep 1;72(5):429

Abstract

Background: Molecular mechanisms underlying stress tolerance and vulnerability are incompletely understood. The fosB gene is an attractive candidate for regulating stress responses, because ΔFosB, an alternative splice product of the fosB gene, accumulates after repeated stress or antidepressant treatments. On the other hand, FosB, the other alternative splice product of the fosB gene, expresses more transiently than ΔFosB but exerts higher transcriptional activity. However, the functional differences of these two fosB products remain unclear.

Methods: We established various mouse lines carrying three different types of fosB allele, wild-type (fosB(+)), fosB-null (fosB(G)), and fosB(d) allele, which encodes ΔFosB but not FosB, and analyzed them in stress-related behavioral tests.

Results: Because fosB(+/d) mice show enhanced ΔFosB levels in the presence of FosB and fosB(d/d) mice show more enhanced ΔFosB levels in the absence of FosB, the function of FosB can be inferred from differences observed between these lines. The fosB(+/d) and fosB(d/d) mice showed increased locomotor activity and elevated Akt phosphorylation, whereas only fosB(+/d) mice showed antidepressive-like behaviors and increased E-cadherin expression in striatum compared with wild-type mice. In contrast, fosB-null mice showed increased depression-like behavior and lower E-cadherin expression.

Conclusions: These findings indicate that FosB is essential for stress tolerance mediated by ΔFosB. These data suggest that fosB gene products have a potential to regulate mood disorder-related behaviors.


Conflict of interest statement

Financial Disclosures

The authors report no biomedical financial interests or potential conflicts of interest.

Figures

Figure 1
Figure 1
Expression of FosB and ΔFosB in the brain of fosB mutant mice. (A–C) Immunohistochmical detection of fosB gene products in mouse brain. Coronal sections of brain prepared from wild-type, fosBd/d, and fosBG/G mice were subjected to immunohistochemistry with anti-FosB(N). The FosB(N) antibody was raised against amino acids 79–131 of the N-terminus common to FosB and ΔFosB. Representative sections are shown. St, striatum; HP, hippocampus (HP). The regional distribution of fosB gene expression is not different between wild-type and fosBd/d mice, and there is no expression of fosB gene products in fosBG/G mice. (D, E) Western blotting analysis of fosB gene products in striatal nuclear extracts. Blotting membranes were reacted with a rabbit monoclonal anti-FosB (5G4, Cell Signaling). The black arrow indicates p43 (FosB), the open arrowheads indicate p32/36 (ΔFosB), the red arrow indicates p31 (vFosB), and the closed arrowhead indicates p24 (Δ2ΔFosB). e(+/+) is enhanced image of wild type result. The blots were stained with Ponceau S (lower panels in D and E). (F) Quantification of FosB, ΔFosB, vFosB, and Δ2ΔFosB bands in striatal samples. Relative values of integrated densities to that of ΔFosB in wild-type mice are shown (n=3–5, mean ± S.E.M.). Expression levels of ΔFosB and Δ2ΔFosB were increased in fosB+/d and fosBd/d mice compared to wild-type mice [ΔFosB: F(2, 12) = 21.47, p = 0.0002; Δ2ΔFosB; F(2, 12) = 24.92, p = 0.0001], while those of FosB and vFosB in fosB+/d mice were apparently decreased [FosB: F(2, 12) = 3.54, p = 0.0689; vFosB: F(2, 12) = 2.6531, p = 0.119]. In the fosB+/G mice, the levels of vFosB and Δ2ΔFosB were significantly decreased, and no fosB gene product was detected in fosBG/G mice [FosB: F(2, 11) = 10.366, p = 0.0046; ΔFosB: F(2, 11) = 16.052, p = 0.0011; vFosB: F(2, 11) = 37.565. p < 0.0001; Δ2ΔFosB; F(2, 11) = 39.063, p < 0.0001]. *, p < 0.05 in Dunnett’s multiple comparison test. #, p < 0.05 in t-test.
Figure 2
Figure 2
Spontaneous locomotor activity, open field, and elevated plus maze tests in fosB mutant mice. Littermates obtained from mating of fosB+/d × fosB+/d (upper panels: A to D), and fosB+/G × fosB+/G (lower panels: E to H), mice were used for the experiments. Upper panels represent data of line d (ΔFosB accumulation type). Lower panels represent data of line G (fosB-null type). (A, B, E, F) Spontaneous locomotor activity during a 12 hr period in the night. Data in panels A and E were obtained in the night of the third day after isolation, those in B and F after 1 month of isolation. Bars represent locomoter counts per 12 hr (mean ± S.E.M.). On the third night, fosBd/d mice showed significantly higher locomotor activity compared to wild-type and fosB+/d mice [F (2, 51) = 8.82; p < 0.001], while fosBG/G mice showed significantly lower locomotor activity compared to wild-type mice [F (2, 60) = 3.87; p = 0.026]. fosB+/d mice also showed significantly higher locomotor activity than wild-type mice [H = 45.0, p < 0.001, Kruskal-Wallis test]. (C, G) Results of the open field test. Bars represent travel distance (cm) for 10 min (mean ± S.E.M.). On the first day, both fosBd/d and fosBG/G mice showed significantly higher locomotor activity than wild-type mice [F (2, 51) = 3.56; p < 0.05 and F (2, 50) = 3.79; p < 0.05, respectively]. fosB+/d and fosBd/d mice [F(2,51) = 4.48; p < 0.05] on the second day, and fosB+/G mice [F(2,50) = 5.96; p < 0.01, and F(2,50) = 4.02; p < 0.05] on the third and fourth days, respectively, exhibited significantly higher locomotor activity than did wild-type mice. (D, H) Results of the elevated plus maze test. Bars represent time in open arm (sec) (mean ± S.E.M.). fosBd/d mice stayed significantly longer in the open arms than wild-type mice [H = 9.79, p = 0.007, Kruskal-Wallis test], and fosBG/G mice spent significantly less time in the open arms [F (2, 45) = 4.91; p < 0.01]. In A to H, #, p < 0.05; ##, p < 0.01; statistical difference between homozygous mice and wild-type mice. *, p < 0.05; **, p < 0.01; statistical difference between heterozygous and homozygous mice. §, p < 0.05; statistical difference between heterozygous and homozygous mice, using ANOVA (Dunnett ’s posthoc test)
Figure 3
Figure 3
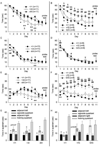
Repeated forced swimming in the Morris water maze in fosB mutant mice. Left panels represent data of line d (ΔFosB accumulation type). Right panels represent data of line G (fosB-null type). (A, B) Escape latency in the hidden platform test. (C, D) Actual swimming time exhibited no gross differences in the mutant mice. (E, F) The difference in time to reach to the hidden platform is dependent on immobility in the water maze. To further study initial stress vulnerability and tolerance over time in this assay, we repeated training for several days. In A–F, all points are shown as mean ± S.E.M. #, p < 0.05; ##, p < 0.01; statistical difference between homozygous mice and wild-type mice. *, p < 0.05; **, p < 0.01; statistical difference between heterozygous and homozygous §, p < 0.05; §§, p < 0.01; statistical difference between heterozygous and homozygous mice, using ANOVA (Dunnett’s posthoc test) (G, H) Time in each quadrant in probe test at 11th day after 10 days training. The white box in the opposite quadrant reflects the time until moving to the other quadrant from the first quadrant. *, p < 0.01; comparison with the training quadrant, using ANOVA (Dunnett ’s posthoc test).
Figure 4
Figure 4
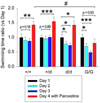
Repeated forced swim test of fosB mutant mice in inescapable condition. Conventional repeated forced swim test was performed once a day for 4 consecutive days. Each trial was performed for 6 min, and relative ratio of swimming time during last 4 min on a given day to that in the day 1 is shown in a bar graph (mean ± S.E.M., n = 12–16). Paroxetine (10 mg/kg) was injected 30 min before the fourth day trial. In fosBG/G mice, the recovery ratio of the swimming time after administration of paroxetine was significantly lower than that seen in wild-type mice [F (3, 56) = 3.11; p < 0.05]. *, p < 0.05; **, p < 0.01; ***, p < 0.001; statistical difference between the day 1 and a given day in each mouse line. #, p < 0.05; statistical difference between fosBG/G and wild-type mice using ANOVA (Dunnett’s posthoc test).
Figure 5
Figure 5
Locomotor activity induced by dopamine receptor agonist s and antagonists in fosB mutant mice. Left panels represent data of line d (ΔFosB accumulation type). Right panels represent data of line G (fosB-null type). Naïve mice, without prior behavioral assays, were housed individually for two weeks, and then placed in a cage with an infrared automatic monitor system for 3 days. On the second day at 4:00 pm, the mice were injected with saline, and on the third day at 4:00 pm the mice were injected with 30 mg/kg methylphenidate (MPH), 2 mg/kg SKF81297 (SKF), 1 mg/kg haloperidol (HAL), or 1 mg/kg LY 171555 (QNP) as shown in Figure S5 in Supplement 1. (A, B) Immediate effects on locomotor activity during the first 4 hr after treatment. Bars represent locomotor counts observed during the first 4 hr from 4:00 pm to 8:00 pm (mean ±S.E.M.). fosB+/d and fosBd/d mice exhibited more hyperactivity in response to MPH than wild-type mice [F (2, 23) = 4.14; p < 0.05]. The total locomotor activity immediately after haloperidol treatment was significantly higher in fosBd/d mice [F (2, 29) = 4.95; p < 0.05], and lower in fosBG/G mice [F (2, 16) = 7.43; p < 0.01], compared to wild-type mice. (C, D) Delayed effects on locomotor activity. Bars represent locomotor counts observed during the last 12 hr from 8:00 pm to 8:00 am in the next day (mean ±S.E.M.). The locomotor activity exhibited in the dark phase after MPH treatment was decreased in fosB+/d mice [F (2, 23) = 3.78; p < 0.05]. In A to D, #, p < 0.05; statistical difference between homozygous mice and wild-type mice, §, p < 0.05; statistical difference between heterozygous and homozygous mice, using ANOVA (Dunnett’s posthoc test). The number of mice is provided in Figure S5 in Supplement 1.
Figure 6
Figure 6
Summary of the effects of different levels of fosB gene products on locomotor activity and stress tolerance. FosB and accumulated ΔFosB amplify stress tolerance and E-cadherin expression cooperatively. Accumulated ΔFosB facilitates Akt phosphorylation and locomotor activity thorough its dopaminergic sensitization, while FosB antagonizes the effects.

References

    1. Nakabeppu Y, Nathans D. A naturally occurring truncated form of FosB that inhibits Fos/Jun transcriptional activity. Cell. 1991;64:751–759. - PubMed
    1. Nakabeppu Y, Nathans D. The basic region of Fos mediates specific DNA binding. EMBO J. 1989;8:3833–3841. - PMC - PubMed
    1. Ohnishi YN, Sakumi K, Yamazaki K, Ohnishi YH, Miura T, Tominaga Y, et al. Antagonistic regulation of cell -matrix adhesion by FosB and ΔFosB/Δ2ΔFosB encoded by alternatively spliced forms of fosB transcripts. Mol Biol Cell. 2008;19:4717–4729. - PMC - PubMed
    1. Kurushima H, Ohno M, Miura T, Nakamura TY, Horie H, Kadoya T, et al. Selective induction of ΔFosB in the brain after transient forebrain ischemia accompanied by an increased expression of galectin-1, and the implication of ΔFosB and galectin-1 in neuroprotection and neurogenesis. Cell Death Differ. 2005;12:1078–1096. - PubMed
    1. Miura T, Ohnishi Y, Kurushima H, Horie H, Kadoya T, Nakabeppu Y. Regulation of the neuronal fate by ΔFosB and its downstream target, galectin-1. Current Drug Targets. 2005;6:437–444. - PubMed

Publication types

MeSH terms