. 2011 Aug;25(8):1326-36.
doi: 10.1210/me.2011-0045. Epub 2011 Jun 16.

The two-pore domain potassium channel KCNK5: induction by estrogen receptor alpha and role in proliferation of breast cancer cells

Affiliations

The two-pore domain potassium channel KCNK5: induction by estrogen receptor alpha and role in proliferation of breast cancer cells

Claudia P Alvarez-Baron et al. Mol Endocrinol. 2011 Aug.

Abstract

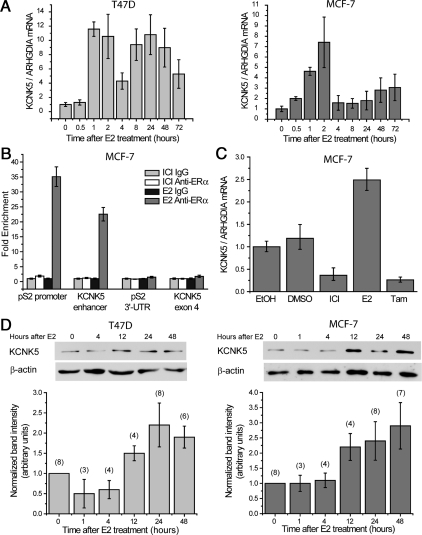
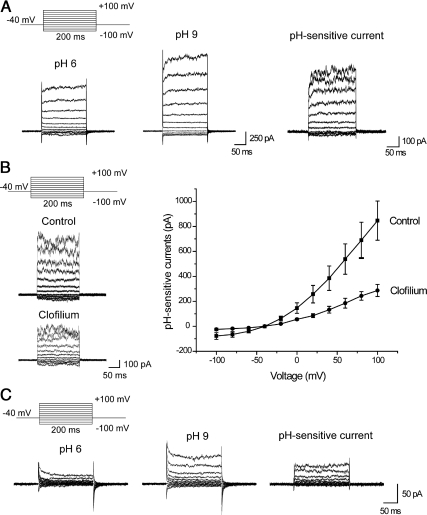
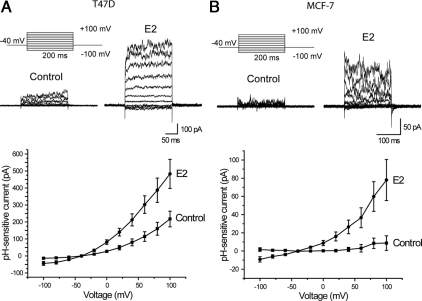
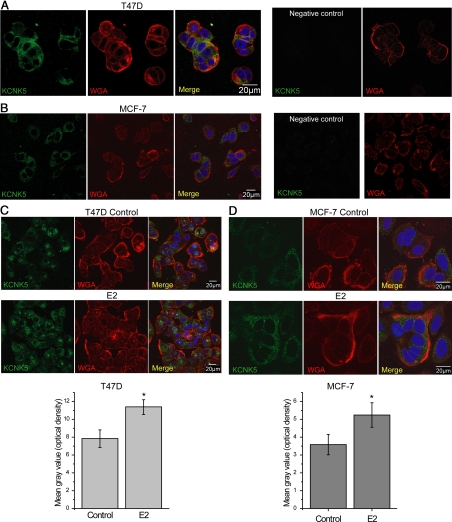
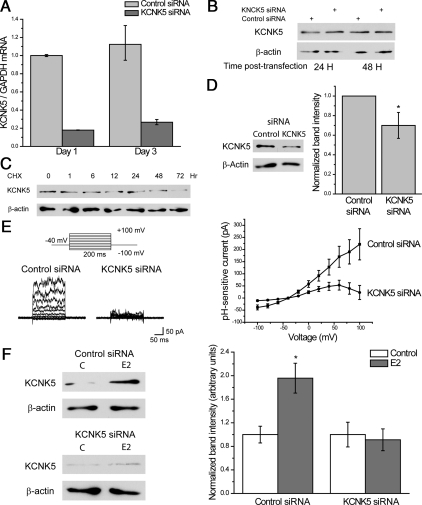
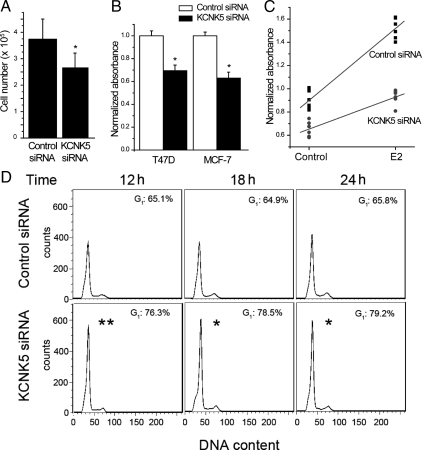
The growth of many human breast tumors requires the proliferative effect of estrogen acting via the estrogen receptor α (ERα). ERα signaling is therefore a clinically important target for breast cancer prevention and therapeutics. Although extensively studied, the mechanism by which ERα promotes proliferation remains to be fully established. We observed an up-regulation of transcript encoding the pH-sensitive two-pore domain potassium channel KCNK5 in a screen for genes stimulated by 17β-estradiol (E2) in the ERα(+) breast cancer cell lines MCF-7 and T47D. KCNK5 mRNA increased starting 1 h after the onset of E2 treatment, and protein levels followed after 12 h. Estrogen-responsive elements are found in the enhancer region of KCNK5, and chromatin immunoprecipitation assays revealed binding of ERα to the KCNK5 enhancer in E2-treated MCF-7 cells. Cells treated with E2 also showed increases in the amplitude of pH-sensitive potassium currents, as assessed by whole-cell recordings. These currents are blocked by clofilium. Although confocal microscopy suggested that most of the channels are located in intracellular compartments, the increase in macroscopic currents suggests that E2 treatment increases the number of active channels at the cell surface. Application of small interfering RNA specific for KCNK5 decreased pH-sensitive potassium currents and also reduced the estrogen-induced proliferation of T47D cells. We conclude that E2 induces the expression of KCNK5 via ERα(+) in breast cancer cells, and this channel plays a role in regulating proliferation in these cell lines. KCNK5 may therefore represent a useful target for treatment, for example, of tamoxifen-resistant breast cancer.


Figures

Fig. 1.
Fig. 1.
Estrogen induces the expression of KCNK5 in ERα+ breast cancer cells. A, Time course of the induction of KCNK5 mRNA by 10 nm E2 in T47D cells (left) and MCF-7 cells (right) synchronized before treatment. The qPCR data were normalized to the reference gene ARHGDIA (n = 2). B, In MCF-7 cells, ERα binds to the promoter and enhancer element of the genes pS2 and KCNK5, respectively. ChIP-qPCR results are shown for treatment with 10 nm ICI 182780 and 10 nm E2, and with unspecific IgG and specific anti-ERα immunoprecipitation (n = 3). ERα binding is enriched neither in the 3′-untranslated region of pS2 nor the fourth exon of KCNK5. C, Data from qPCR show the repressive effects of 10 nm ICI 182780 and 10 nm tamoxifen (Tam) on basal levels of KCNK5 mRNA in MCF-7 cells growing in serum-containing complete medium. Application of 10 nm E2 increased the level of KCNK5 in cells growing in these conditions. KCNK5 levels in cells treated with the vehicles EtOH and dimethylsulfoxide (DMSO) are presented as controls. Cells were treated for 24 h without previous synchronization. D, Time course of the increase in KCNK5 protein induced by 10 nm E2 in T47D (left) and MCF-7 cells (right). Immunoblots show an increase in KCNK5 in extracts obtained from synchronized T47D and MCF-7 cells treated with 10 nm E2 for 12 h or more. Bar graphs show the quantification of immunoblots normalized to β-actin and control (0 time point). The number of replicates for each time point is indicated above each bar. In this and subsequent figures, error bars represent mean ± sem.
Fig. 2.
Fig. 2.
pH-sensitive currents can be detected in ERα+ breast cancer cells. A, Traces from a representative T47D cell showing whole-cell currents measured at pH 6 (left), pH 9 (middle), and the current at pH 6 subtracted from the current at pH 9 (right). External solutions contained 10 mm TEA throughout this experiment. B, Clofilium blocks pH-sensitive currents in T47D cells. Representative traces of pH-sensitive currents (left) and current-voltage (I–V) plots (right) showing a reduction in the pH-sensitive currents when 25 μm clofilium is applied in the bath. The I–V plots were constructed from pH-sensitive currents from seven control cells and six cells treated with clofilium. C, MCF-7 cells show pH-sensitive currents that are somewhat smaller in amplitude.
Fig. 3.
Fig. 3.
Increase in pH-sensitive currents in T47D and MCF-7 cells treated with E2. A, Representative traces (top) and I–V plots (bottom) showing an increase in the pH-sensitive currents in synchronized T47D cells treated with 10 nm E2 for 24 h. The I–V plot was constructed from 13 cells in both treatment groups. B, pH-sensitive currents were also increased in MCF-7 cells treated with E2. I–V plot was constructed from eight control and 10 E2 treated cells.
Fig. 4.
Fig. 4.
KCNK5 localization is predominantly intracellular in T47D and MCF-7 cells. A, Representative confocal images of T47D cells showing a predominant intracellular localization of the channel with small areas of overlap with the plasma membrane marker WGA. Some diffusion of WGA into the cells during the staining was observed. The nuclear stain 4′,6-diamidino-2-phenylindole is included in overlay images. No signal was observed in T47D cells stained in the absence of primary antibody (negative control). B, Representative images showing KCNK5 localization in MCF-7 cells. Signal was less intense, and there was limited colocalization with WGA. C, Representative images of control (top) or synchronized T47D cells treated with 10 nm E2 for 24 h (bottom) showing no qualitative change in the localization of the channel. The bar graph shows the quantification of the mean optical density in control and E2-treated cells (n = 25). A significant (P < 0.05) increase in the intensity of the signal can be observed in cells treated with E2. D, Similar observations in synchronized MCF-7 cells. The bar graph shows summary quantifications for nine cells (P < 0.05). In panels C and D, cells were processed in parallel, and images were obtained using constant settings on the confocal microscope to facilitate comparisons of signal intensity.
Fig. 5.
Fig. 5.
KCNK5 proteins have a long half-life in T47D cells. A, siRNA treatment of T47D cells reduced mRNA levels of KCNK5 effectively over 3 d, as compared with cells treated with control siRNA. B, Representative immunoblot showing the lack of an efficient reduction in KCNK5 protein 1–2 d after KCNK5 siRNA transfection in T47D cells. A single transfection with KCNK5 siRNA was insufficient to obtain a robust decrease in KCNK5 proteins in T47D cells. Similar results were observed after 3–4 d of transfection (data not shown). C, KCNK5 protein has a long half-life. Immunoblot showing the effect of treatment with the protein synthesis blocker cyclohemixide (CHX, 100 μg/ml) for different periods of time on the level of KCNK5 in T47D cells. D, Three cycles of transfection with KCNK5 siRNA gave a significant reduction of the channel at the protein level. A representative immunoblot is shown to the left, and the bar graph shows the densitometric analysis of the effect of KCNK5 siRNA (n = 6). E, KCNK5 siRNA blocked most of the pH-sensitive currents in T47D cells. Representative traces (left) and I–V plot (right) showing a reduction in the pH-sensitive currents in cells transfected with KCNK5 siRNA compared with cells transfected with control siRNA. The I–V plot is constructed from mean current amplitudes recorded from 11 cells in each group. F, Representative immunoblots showing KCNK5 in cells transfected with control siRNA or KCNK5 siRNA for 6 d and treated with either vehicle or 10 nm E2 for 5 d starting 1 d after the first transfection (left). E2 induced an increase in KCNK5 in cells transfected with control siRNA but not in KCNK5 siRNA. A reduction in the basal level of KCNK5 was obtained in experimental cultures. The bar graph to the right summarizes the level of KCNK5 normalized to actin and the respective control in cells transfected and treated with E2 for three repetitions of this experiment. GAPDH, Glyceraldehyde-3-phosphate dehydrogenase.
Fig. 6.
Fig. 6.
Knocking down KCNK5 decreases proliferation in T47D and MCF-7 cells. A, Bar graph showing total cell counts in cultures transfected with control or KCNK5 siRNA. A significant decrease was observed in cells treated with KCNK5 siRNA (n = 8). B, Transfected cultures were incubated with the MTS reagent to evaluate cell proliferation. Bar graphs show the absorbance in cells treated with KCNK5 siRNA normalized to the absorbance of the respective control siRNA cells within each experiment (n = 5 for T47D cells and n = 3 for MCF-7 cells). Proliferation was significantly reduced in T47D and MCF-7 cells transfected with KCNK5 siRNA for 6 d. C. Graph showing the normalized absorbance in synchronized cultures transfected with control or KCNK5 siRNA and treated with 10 nm E2 or vehicle for 5 d (n = 6 experiments in each group). Absorbances were normalized to the mean of each experiment. A significantly smaller increase induced by E2 was observed in cells transfected with KCNK5 siRNA. Two-way ANOVA revealed significant effects of E2 treatment, KCNK5 siRNA, and a significant interaction effect between these treatments (see text). D, Analysis of cell cycle by flow cytometry was performed to investigate the reduced proliferation caused by siRNAs targeting KCNK5. Numbers in the histograms show the percentage of cells in G1 phase of the cell cycle. The higher percentage of KCNK5 siRNA cells in G1 phase compared with the control siRNA cells suggests that knockdown of KCNK5 keeps the cells in G1/S cell-cycle arrest. The asterisk indicates a statistically significant difference (P < 0.05) between cells transfected with control and KCNK5 siRNA various times after E2 treatment.

References

    1. Dubik D, Shiu RP. 1992. Mechanism of estrogen activation of c-myc oncogene expression. Oncogene 7:1587–1594 - PubMed
    1. Ström A, Hartman J, Foster JS, Kietz S, Wimalasena J, Gustafsson JA. 2004. Estrogen receptor β inhibits 17β-estradiol-stimulated proliferation of the breast cancer cell line T47D. Proc Natl Acad Sci USA 101:1566–1571 - PMC - PubMed
    1. Williams C, Edvardsson K, Lewandowski SA, Ström A, Gustafsson JA. 2008. A genome-wide study of the repressive effects of estrogen receptor β on estrogen receptor α signaling in breast cancer cells. Oncogene 27:1019–1032 - PubMed
    1. Reyes R, Duprat F, Lesage F, Fink M, Salinas M, Farman N, Lazdunski M. 1998. Cloning and expression of a novel pH-sensitive two pore domain K+ channel from human kidney. J Biol Chem 273:30863–30869 - PubMed
    1. Morton MJ, Abohamed A, Sivaprasadarao A, Hunter M. 2005. pH sensing in the two-pore domain K+ channel, TASK2. Proc Natl Acad Sci USA 102:16102–16106 - PMC - PubMed

Publication types

MeSH terms