. 2011 Aug 1;22(15):2787-95.
doi: 10.1091/mbc.E11-01-0028. Epub 2011 Jun 16.

Dynamic profiling of mRNA turnover reveals gene-specific and system-wide regulation of mRNA decay

Affiliations

Dynamic profiling of mRNA turnover reveals gene-specific and system-wide regulation of mRNA decay

Sarah E Munchel et al. Mol Biol Cell. .

Abstract

RNA levels are determined by the rates of both transcription and decay, and a mechanistic understanding of the complex networks regulating gene expression requires methods that allow dynamic measurements of transcription and decay in living cells with minimal perturbation. Here, we describe a metabolic pulse-chase labeling protocol using 4-thiouracil combined with large-scale RNA sequencing to determine decay rates of all mRNAs in Saccharomyces cerevisiae. Profiling in various growth and stress conditions reveals that mRNA turnover is highly regulated both for specific groups of transcripts and at the system-wide level. For example, acute glucose starvation induces global mRNA stabilization but increases the degradation of all 132 detected ribosomal protein mRNAs. This effect is transient and can be mimicked by inhibiting the target-of-rapamycin kinase. Half-lives of mRNAs critical for galactose (GAL) metabolism are also highly sensitive to changes in carbon source. The fast reduction of GAL transcripts in glucose requires their dramatically enhanced turnover, highlighting the importance of mRNA decay in the control of gene expression. The approach described here provides a general platform for the global analysis of mRNA turnover and transcription and can be applied to dissect gene expression programs in a wide range of organisms and conditions.


Figures

FIGURE 1:
FIGURE 1:
Pulse-chase methodology for measuring mRNA turnover. (A) Schematic of pulse-chase protocol for determining genome-wide mRNA half-lives. Cultures were grown in the presence of 0.2 mM 4TU and then shifted into medium containing 20 mM uracil. Total RNA was isolated at different times after the shift into the chase media. A constant amount of 4TU-containing control RNA was spiked in as a reference for analysis. Each sample was biotinylated, enriched for mRNA populations, and purified on streptavidin beads. Samples were then analyzed following standard RNA-seq protocols. For details see Supplemental Materials. (B) Sulfur-modified nucleotides are rapidly incorporated into RNA. S. cerevisiae cells were grown to midlog phase in minimal medium. At t = 0, 0.2 mM 4TU was added to the medium, and samples were collected at indicated time points. Total RNA was isolated, incubated with biotin-HPDP to label 4TU-modified RNA, and separated by gel. Total RNA was monitored by ethidium bromide staining and biotin was detected by streptavidin–horseradish peroxidase (HRP). (C) 4TU incorporation is completely suppressed in the presence of 20 mM uracil. Yeast cultures were grown in minimal medium with indicated concentrations of uracil and 4TU for two doublings. Total RNA was isolated and labeled with biotin-HPDP and separated by gel electrophoresis and transferred to a nitrocellulose membrane. Total RNA levels were monitored by methylene blue staining, and biotinylated population was detected by streptavidin-HRP. (D) Data for all time points for each transcript were fitted to a first-order exponential decay model, and the R2 value was calculated. The distribution of the R2 values for all mRNAs is shown.
FIGURE 2:
FIGURE 2:
4TU pulse chase is highly reproducible. Comparison of steady-state mRNA levels at individual time points for two independent biological replicates grown in dextrose. The x- and y-axes indicate number of transcripts ×104. The R values are indicated for each time point.
FIGURE 3:
FIGURE 3:
Steady-state growth analysis in glucose. (A) Individual decay curves for transcripts show a wide distribution of half-lives. Transcript abundance for each transcript was normalized to the 10-min time point. A single-exponential decay curve was fitted to all time points for each mRNA, and individual half-lives were calculated. (B) mRNA half-life distribution for cells grown in 2% glucose. Vertical lines mark approximately ±1 SD from the mean of the distribution, which contains 91% of the transcripts. Functionally related groups of mRNAs that are significantly enriched in the tails of the distribution (more than 1 SD from the mean) were identified by GO and are reported with p values. The mean, SD, and median were calculated for all genes that had a half-life between 0 and 200 min.
FIGURE 4:
FIGURE 4:
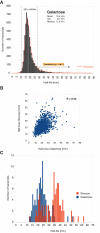
Steady-state growth analysis in galactose. (A) mRNA half-life distribution for cells grown in 2% galactose. Vertical lines mark approximately ±1 SD from the mean of the distribution, which contains 92% of the transcripts. The group of mRNAs functioning in translation is significantly enriched within mRNAs, which have half-lives that are longer than 1 SD from the mean. mRNA groups were identified by GO and are reported with p values. The half-life distribution for cells grown in glucose (Figure 3B) is overlaid in red for comparison. The mean, SD, and median were calculated for all genes that had a half-life between 0 and 200 min. (B) Comparison of individual mRNA half-lives for cells grown in glucose or galactose. The x- and y-axes indicate mRNA half-lives in minutes in galactose and glucose, respectively. The correlation coefficient (R) was calculated for all mRNA half-lives that have R2 > 0.8 in both conditions. (C) Distributions of mRNA half-lives for transcripts involved in RNA-mediated transposition in glucose (red) vs. galactose (blue)
FIGURE 5:
FIGURE 5:
Acute perturbations. (A) Half-life distribution for cells upon acute shift from 2% glucose into 2% galactose. For comparison, the half-life distribution for cells grown in glucose (Figure 3B) is overlaid in red. (B) In vivo localization of Dhh1-GFP, a P-body marker, in 2% glucose (left), 30 min following shift from 2% glucose to 2% galactose (middle), and in 2% galactose (right). Bar, 5 μm. (C) mRNA half-life distributions for transcripts involved in translation in glucose (red), galactose (blue), glucose-to-galactose shift (purple), galactose-to-glucose shift (green), and upon rapamycin treatment in glucose (yellow). (D) Distribution of mRNA half-lives for cells treated with rapamycin. The mean, SD, and median were calculated for all genes that had a half-life between 0 and 200 min. For comparison, the half-life distribution for cells grown in glucose (Figure 3B) is overlaid in red.

References

    1. Albig AR, Decker CJ. The target of rapamycin signaling pathway regulates mRNA turnover in the yeast Saccharomyces cerevisiae. Mol Biol Cell. 2001;12:3428–3438. - PMC - PubMed
    1. Balagopal V, Parker R. Polysomes, P bodies and stress granules: states and fates of eukaryotic mRNAs. Curr Opin Cell Biol. 2009;21:403–408. - PMC - PubMed
    1. Bennett MR, Pang WL, Ostroff NA, Baumgartner BL, Nayak S, Tsimring LS, Hasty J. Metabolic gene regulation in a dynamically changing environment. Nature. 2008;454:1119–1122. - PMC - PubMed
    1. Boeke JD, Garfinkel DJ, Styles CA, Fink GR. Ty elements transpose through an RNA intermediate. Cell. 1985;40:491–500. - PubMed
    1. Brown EJ, Albers MW, Shin TB, Ichikawa K, Keith CT, Lane WS, Schreiber SL. A mammalian protein targeted by G1-arresting rapamycin-receptor complex. Nature. 1994;369:756–758. - PubMed

Publication types

MeSH terms

LinkOut - more resources