. 2011 Jul 22;333(6041):453-6.
doi: 10.1126/science.1207193. Epub 2011 Jun 16.

De-AMPylation of the small GTPase Rab1 by the pathogen Legionella pneumophila

Affiliations

De-AMPylation of the small GTPase Rab1 by the pathogen Legionella pneumophila

M Ramona Neunuebel et al. Science. .

Abstract

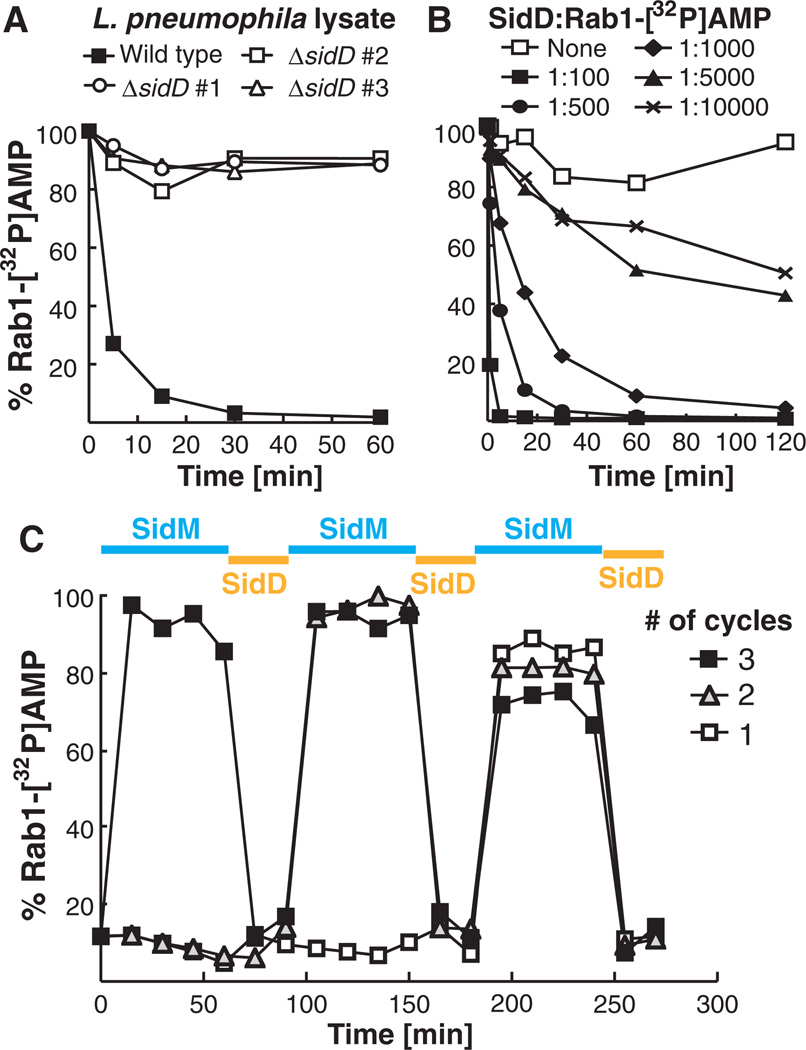
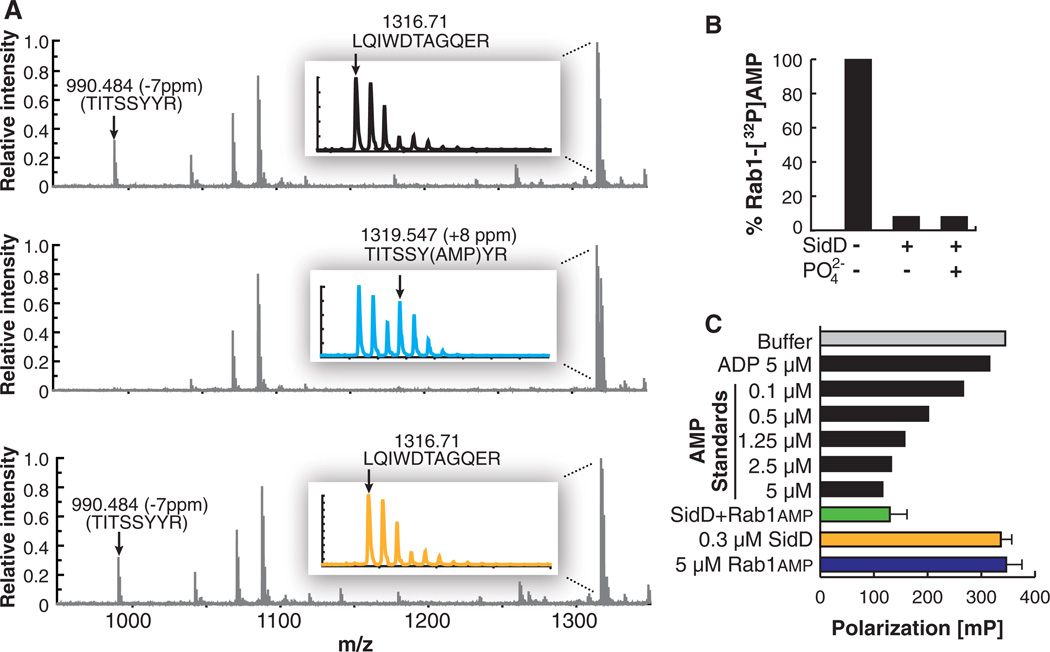
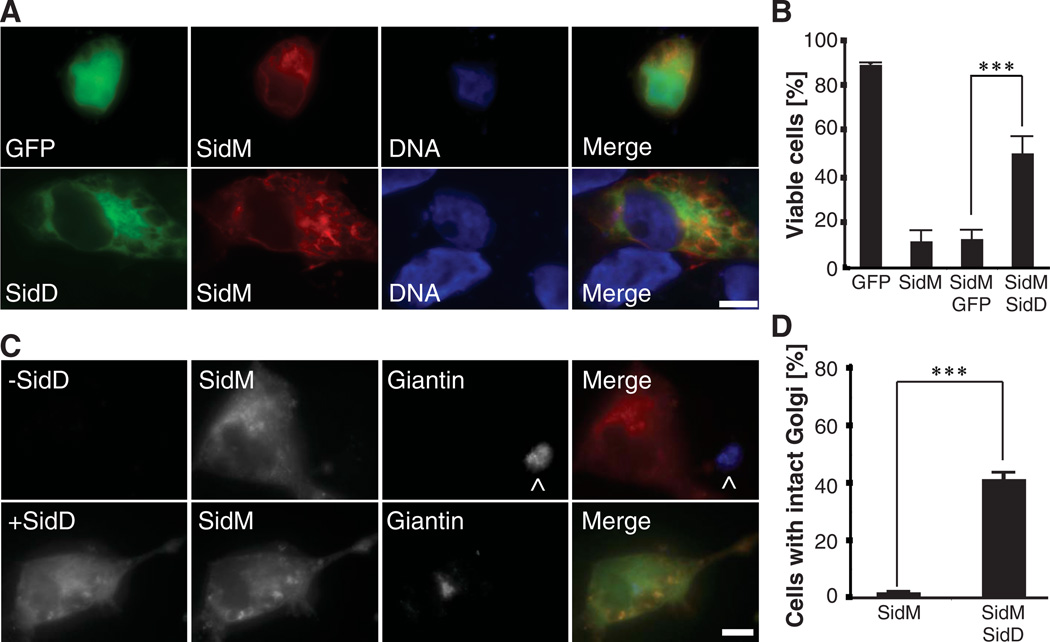
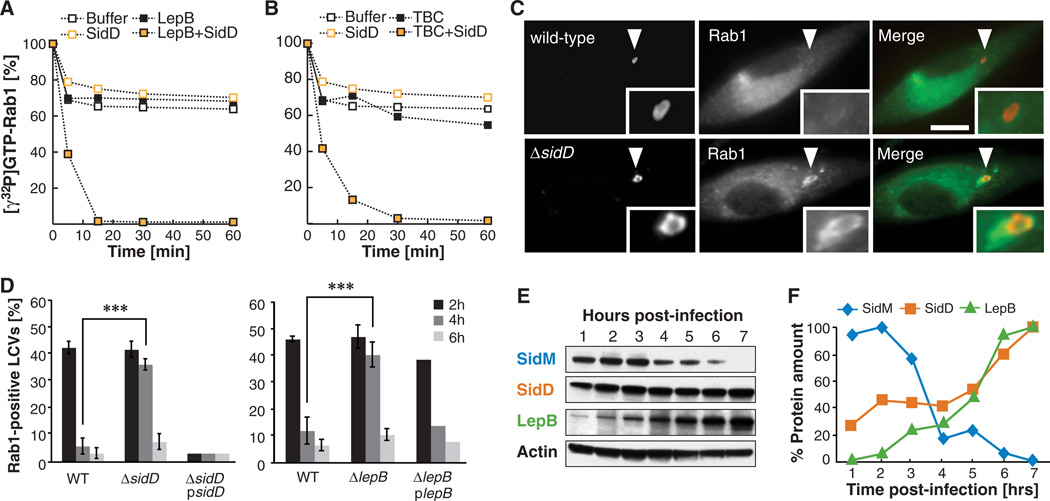
The bacterial pathogen Legionella pneumophila exploits host cell vesicle transport by transiently manipulating the activity of the small guanosine triphosphatase (GTPase) Rab1. The effector protein SidM recruits Rab1 to the Legionella-containing vacuole (LCV), where it activates Rab1 and then AMPylates it by covalently adding adenosine monophosphate (AMP). L. pneumophila GTPase-activating protein LepB inactivates Rab1 before its removal from LCVs. Because LepB cannot bind AMPylated Rab1, the molecular events leading to Rab1 inactivation are unknown. We found that the effector protein SidD from L. pneumophila catalyzed AMP release from Rab1, generating de-AMPylated Rab1 accessible for inactivation by LepB. L. pneumophila mutants lacking SidD were defective for Rab1 removal from LCVs, identifying SidD as the missing link connecting the processes of early Rab1 accumulation and subsequent Rab1 removal during infection.


Figures

Fig. 1
Fig. 1
L. pneumophila SidD has Rab1 de-AMPylation activity. All de-AMPylation experiments were monitored by radioactive filter-binding assays measuring the levels of Rab1-[32P]AMP, with each graph being a representative of at least three independent experiments. (A) L. pneumophila WT but not ΔsidD lysate has Rab1 de-AMPylation activity. Rab1-[32P]AMP (1 µM) was incubated with lysate (100 µg) from L. pneumophila WT or three independently generated ΔsidD mutants (#1 to 3). (B) SidD is sufficient to de-AMPylate Rab1. Rab1-[32P]AMP (1 µM) was incubated with purified glutathione S-transferase (GST)–SidD at the indicated molar ratios. (C) Rab1 can be repeatedly AMPylated and de-AMPylated. Three independent samples containing equal amounts of Rab1 (10 µM) were used in up to three consecutive cycles of AMPylation (blue) and de-AMPylation (orange) by incubation with SidM- and SidD-coated magnetic beads, respectively.
Fig. 2
Fig. 2
De-AMPylation catalyzed by SidD restores Rab1 and generates AMP. (A) Matrix-assisted laser desorption/ionization–time-of-flight reflector spectra of tryptic digestion of three samples. Mass errors of labeled peptides are shown in parts per million (ppm) relative to predicted values. (Top) Unmodified Rab1. (Middle) Rab1 with AMPylation showing loss of intensity of 72TITSSYYR79 peptide, mass-to-charge ratio (m/z) 990, and existence of AMPylated peptide at m/z 1319. (Bottom) Rab1 after de-AMPylation. Peptide at m/z 1319 disappears and m/z 990 peptide reappears. The insets show magnification of the peaks around m/z 1319. A, Ala; D, Asp; E, Glu; G, Gly; L, Leu; Q, Gln; W, Trp. (B) Rab1 de-AMPylation by SidD is phosphate-independent. Rab1 (1 µM) was incubated in the presence (+) or absence (−) of GST-SidD or orthophosphate (as indicated). (C) SidD-catalyzed de-AMPylation of Rab1 generates AMP. AMP was detected by a competitive fluorescence polarization immunoassay. AMP and ADP standards are shown as positive and negative assay controls, respectively. Error bars indicate SD from three independent experiments.
Fig. 3
Fig. 3
SidD protects cells from SidM-induced cytotoxicity and Golgi fragmentation. (A) SidD reduces SidM-induced cytotoxicity. COS1 cells cotransfected with plasmids encoding GFP (top panels) or GFP-SidD (bottom panels) and mCherry-SidM were fixed, and nuclei were labeled using Hoechst stain. (B) Quantification of (A) showing the percentage of cells with normal nuclear morphology. Data are mean ± SD (error bars) for three independent experiments. ***P < 0.001 (two-tailed t test). (C) COS1 cells producing mCherry-SidM only (−SidD; top panel) or mCherry-SidM and GFP-SidD (+SidD; bottom panel) were fixed and stained with the Golgi marker giantin. The merged images (right) show SidD (green), SidM (red), and giantin (blue). The ^ symbol denotes Golgi of a nontransfected cell. (D) Percentage of cells with intact Golgi structures are quantified. Data are mean ± SD from three independent experiments. ***P < 0.001 (two-tailed t test). (A and C) Scale bars, 1 µm.
Fig. 4
Fig. 4
SidD is required for Rab1 inactivation by LepB and removal from LCVs. (A and B) De-AMPylation enables GAP-stimulated GTP hydrolysis by Rab1. GTP hydrolysis of Rab1-AMP (1 µM) loaded with [γ32P]GTP in the absence or presence of GST-SidD (0.35 µM) and 40 nM His-LepB1–1232 (A) or His-TBC1D201–364 (B). Rab1-[γ32P]GTP levels were monitored over time by a filter-binding assay. Graphs are representatives of at least three independent experiments. (C and D) L. pneumophila ΔsidD mutants are defective for Rab1 removal from LCVs. Bone marrow–derived A/J mouse macrophages were challenged with the indicated L. pneumophila strains. (C) Examples of cells four hours after infection. Cells were fixed at the indicated time points and stained for intracellular bacteria (left panels;, WT or a ΔsidD mutant) and Rab1 (middle panels). Merged images (right panels) show bacteria in red and Rab1 in green. Arrowheads indicate locations of the LCVs magnified in the insets. Scale bar, 1 µm. (D) Percentile of LCVs showing colocalization with host cell Rab1 at the indicated times after infection. The graph shows means ± SD (error bars) from three independent experiments. ***P < 0.001 (two-tailed t test). (E and F) Temporal regulation of effector translocation. (E) U937 cells were challenged with L. pneumophila WT or a T4SS-defective mutant (Lp03) (fig. S14) and were lysed at the indicated time points using 1% digitonin. The digitonin-soluble fraction was analyzed by Western blot using antibody specific for the respective effector proteins. (F) Signals shown in (E) were quantified and normalized to the loading control (β-actin), with the maximum signal arbitrarily set to 100%. This graph is a representative of two independent experiments.

Comment in

References

    1. Yarbrough ML, et al. Science. 2009;323:269. 10.1126/science.1166382. - PubMed
    1. Worby CA, et al. Mol. Cell. 2009;34:93. - PMC - PubMed
    1. Müller MP, et al. Science. 2010;329:946. 10.1126/science.1192276. - PubMed
    1. Ensminger AW, Isberg RR. Curr. Opin. Microbiol. 2009;12:67. - PMC - PubMed
    1. Murata T, et al. Nat. Cell Biol. 2006;8:971. - PubMed

Publication types

MeSH terms