. 2011:3:551-64.
doi: 10.1093/gbe/evr056. Epub 2011 Jun 16.

Contrasting 5' and 3' evolutionary histories and frequent evolutionary convergence in Meis/hth gene structures

Affiliations

Contrasting 5' and 3' evolutionary histories and frequent evolutionary convergence in Meis/hth gene structures

Manuel Irimia et al. Genome Biol Evol. 2011.

Abstract

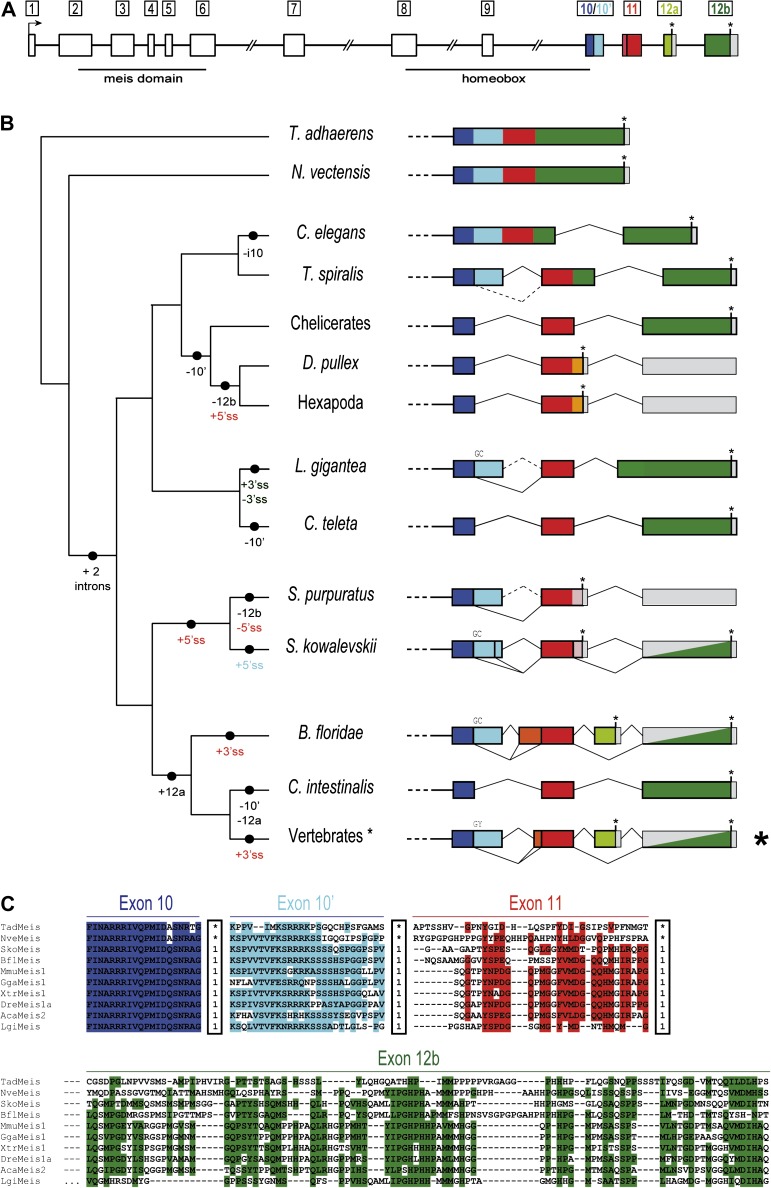
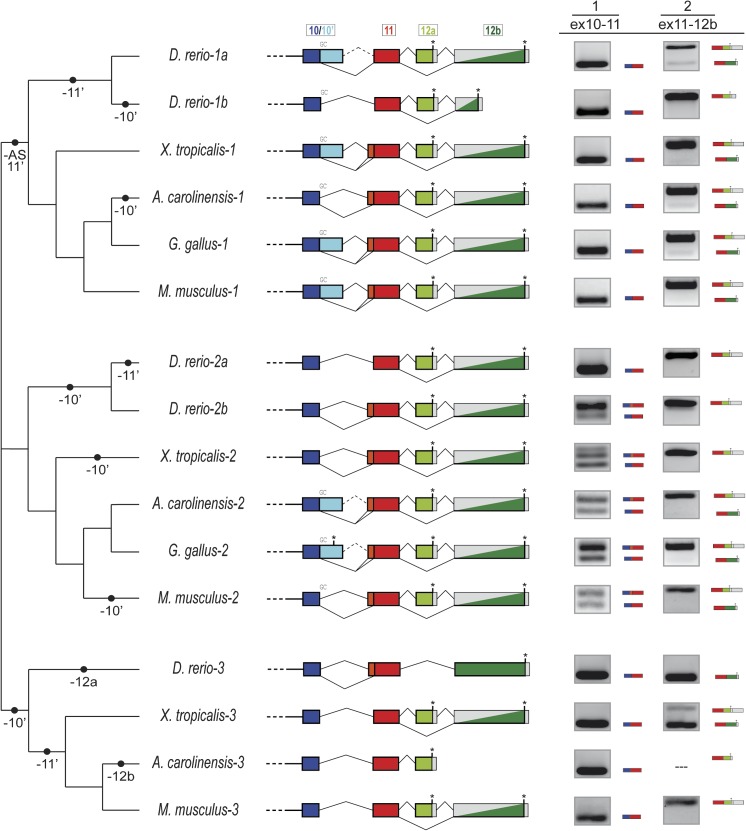
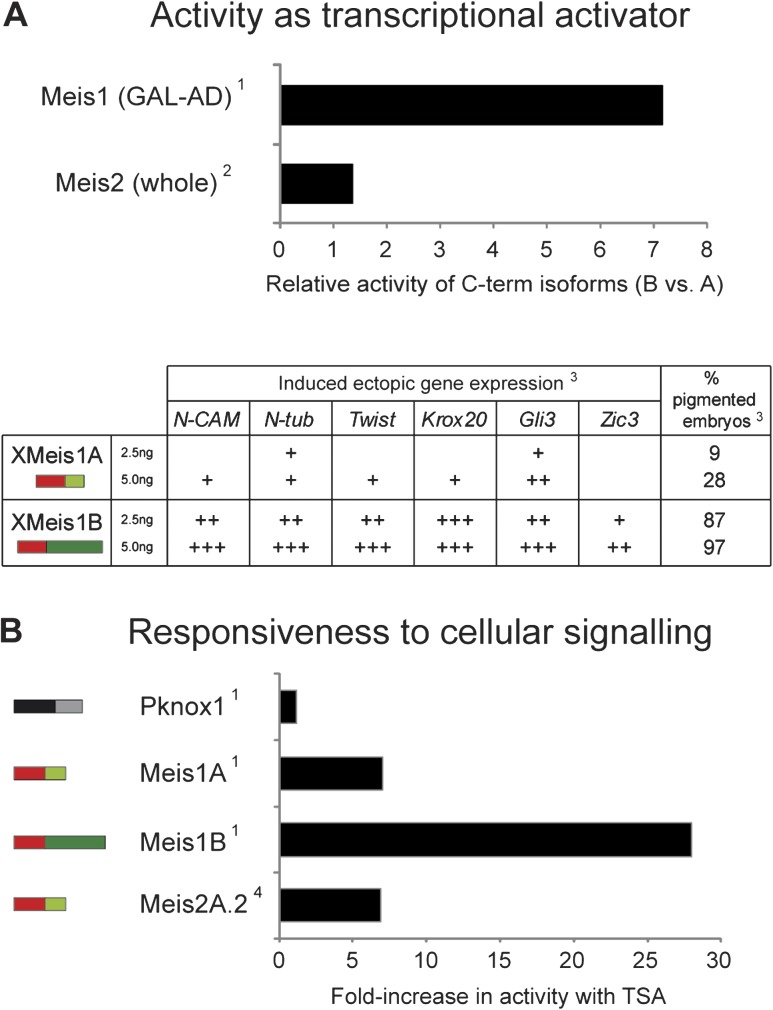
Organisms show striking differences in genome structure; however, the functional implications and fundamental forces that govern these differences remain obscure. The intron-exon organization of nuclear genes is involved in a particularly large variety of structures and functional roles. We performed a 22-species study of Meis/hth genes, intron-rich homeodomain-containing transcription factors involved in a wide range of developmental processes. Our study revealed three surprising results that suggest important and very different functions for Meis intron-exon structures. First, we find unexpected conservation across species of intron positions and lengths along most of the Meis locus. This contrasts with the high degree of structural divergence found in genome-wide studies and may attest to conserved regulatory elements residing within these conserved introns. Second, we find very different evolutionary histories for the 5' and 3' regions of the gene. The 5'-most 10 exons, which encode the highly conserved Meis domain and homeodomain, show striking conservation. By contrast, the 3' of the gene, which encodes several domains implicated in transcriptional activation and response to cell signaling, shows a remarkably active evolutionary history, with diverse isoforms and frequent creation and loss of new exons and splice sites. This region-specific diversity suggests evolutionary "tinkering," with alternative splicing allowing for more subtle regulation of protein function. Third, we find a large number of cases of convergent evolution in the 3' region, including 1) parallel losses of ancestral coding sequence, 2) parallel gains of external and internal splice sites, and 3) recurrent truncation of C-terminal coding regions. These results attest to the importance of locus-specific splicing functions in differences in structural evolution across genes, as well as to commonalities of forces shaping the evolution of individual genes along different lineages.


Figures

F<sc>IG.</sc> 1.
FIG. 1.
Evolution of the intron–exon structures of the C-termini of Meis/hth. (A) Schematic representation of the intron–exon structure of a prototypical vertebrate Meis gene. The conserved long size of introns 6–9 are indicated by a double slash. Homologous coding regions (exons) in the 3′ are indicated by colors: 10 (dark blue), 10′ (light blue), 11 (red), 12a (light green), and 12b (dark green). (B) Diversity of intron–exon structures of exons 10–12b in metazoans. The different genomic gains (+) and losses (−) of regions or splice sites (5′ splice site (SS) or 3′ ss, colored according to the exon), assuming parsimony, are indicated in the branches of the schematic tree on the left-hand side. Solid vertical bars between colors represent a conserved 5′ ss, and GC 5′ ss are indicated above each line. Asterisks represent termination codons and gray blocks indicate UTR exons. Split gray/colored boxes indicate regions that are either translated or 3′ UTR depending on splice form. (C) Sequence alignment for some representative bilaterians and the two non-bilaterians showing sequence conservation at each exon. Within the boxes, “1” indicates a phase 1 intron, and an asterisk represents absence of an intron at that position. Highlighted positions correspond to 60% of similar amino acid types across studied genes, as generated by BioEdit.
F<sc>IG</sc>. 2.
FIG. 2.
Evolution of intron–exon structures and alternative splicing of the 3′ end of vertebrate Meis genes. Diversity of intron–exon structures of exons 10–12b in vertebrates. The different genomic gains (+) and losses (−) of regions, assuming parsimony, are indicated in the branches of the schematic tree on the left-hand side. Solid vertical bars between colors represent a conserved 5′ splice site (SS), and GC 5′ ss are indicated above each line. Asterisks represent termination codons and gray blocks indicate UTR exons. Split gray/colored boxes indicate regions that are either translated or 3′ UTR depending on splice form. RT-PCR results for each event are shown on the right-hand side.
F<sc>IG</sc>. 3.
FIG. 3.
Summary of previous studies showing the different functional properties of C-terminal isoforms. (A) Differences in activity as transcriptional activators between C-terminal isoforms within each paralogous Meis gene in mammals. Top: histogram showing the ratio for activity of B (excluding 12a) versus A (including 12a) isoforms. Data for Meis1 correspond to a protein fusion of the activation domain (AD, C-terminus) from each of the isoforms. Meis2 data correspond to comparisons of full-length proteins and averaging the values for isoforms derived of inclusion/exclusion of exon 11′. Bottom: table summarizing the phenotypic results after injecting two different concentrations of full-length Meis1A or Meis1B isoforms in Xenopus embryos. Note that the intensity of the effect is not only isoform dependent but also concentration dependent. (B) Different C-terminal isoforms have different responses to TSA treatment. Histogram showing the fold-increase in transcriptional activation after TSA treatment for each Meis1 isoform, Meis2A.2 (excluding 11′ but including 12a) and the related pknox1 gene. References: (1) Huang et al. (2005), (2) Yang et al. (2000), (3) Maeda et al. (2001), and (4) Shim et al. (2007).

References

    1. Abascal F, Zardoya R, Posada D. ProtTest: selection of best-fit models of protein evolution. Bioinformatics. 2005;21:2104–2105. - PubMed
    1. Adams MD, et al. The genome sequence of Drosophila melanogaster. Science. 2000;287:2185–2195. - PubMed
    1. Alexander RP, Fang G, Rozowsky J, Snyder M, Gerstein MB. Annotating non-coding regions of the genome. Nat Rev Genet. 2010;11:559–571. - PubMed
    1. Aparicio S, et al. Whole-genome shotgun assembly and analysis of the genome of Fugu rubripes. Science. 2002;297:1301–1310. - PubMed
    1. Azcoitia V, Aracil M, Martínez-A C, Torres M. The homeodomain protein Meis1 is essential for definitive hematopoiesis and vascular patterning in the mouse embryo. Dev Biol. 2005;280:307–320. - PubMed

Publication types