Review
. 2011 Jul 1;12(7):657-63.
doi: 10.1038/embor.2011.116.

Prediction of amyloid aggregation in vivo

Affiliations
Review

Prediction of amyloid aggregation in vivo

Mattia Belli et al. EMBO Rep. .

Abstract

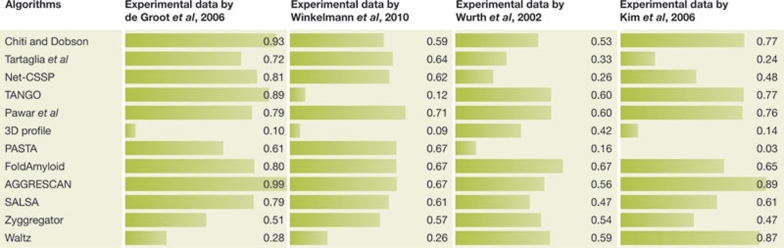
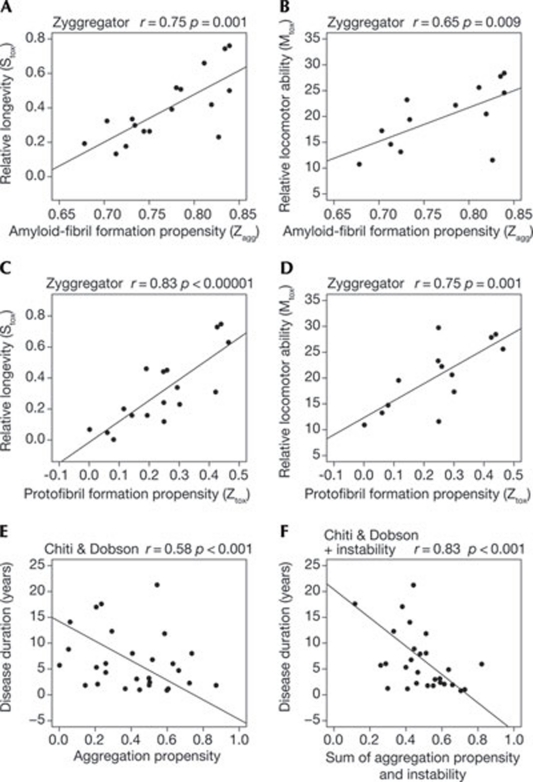
Many human diseases owe their pathology, to some degree, to the erroneous conversion of proteins from their soluble state into fibrillar, β-structured aggregates, often referred to as amyloid fibrils. Neurodegenerative diseases, such as Alzheimer and spongiform encephalopathies, as well as type 2 diabetes and both localized and systemic amyloidosis, are among the conditions that are associated with the formation of amyloid fibrils. Several mathematical tools can rationalize and even predict important parameters of amyloid fibril formation. It is not clear, however, whether such algorithms have predictive powers for in vivo systems, in which protein aggregation is affected by the presence of other biological factors. In this review, we briefly describe the existing algorithms and use them to predict the effects of mutations on the aggregation of specific proteins, for which in vivo experimental data are available. The comparison between the theoretical predictions and the experimental data obtained in vivo is shown for each algorithm and experimental data set, and statistically significant correlations are found in most cases.


Conflict of interest statement

The authors declare that they have no conflict of interest.

Figures

Figure 1
Figure 1
Predicted change in the aggregation propensity after mutation compared with in vivo experimental solubility in Escherichia coli cytosol for Aβ42 variants. Each graph reports the predicted change in the aggregation propensity after mutation (calculated according to the algorithm indicated in each graph and following the procedure described in the supplementary information online) compared with experimental relative fluorescence of GFP fused to Aβ42 mutants in E. coli cytosol, as described previously (de Groot et al, 2006). A value of 0 on the y-axis corresponds to a value of 1 on the x-axis (no change, relative to wild type). Scales on the y-axis have been adjusted to show, for each plot, the full data set. The lines represent the best fits of the data to linear functions. For each plot, the name of the algorithm used is reported, as well as the absolute value of the Pearson linear correlation coefficient (r) and the statistical significance of the slope (p). Aβ42, 42-residue-long amyloid-β peptide; GFP, green fluorescent protein.
Figure 2
Figure 2
Predicted change in the aggregation propensity after mutation compared with in vivo experimental solubility in Escherichia coli cytosol for HypF-N variants. Each graph reports the predicted change in the aggregation propensity after mutation (calculated according to the algorithm indicated in each graph and following the procedure described in the supplementary information online) compared with experimental solubility in E. coli cytosol (ISN/IP) of the mutants of HypF-N, as described previously (Winkelmann et al, 2010). A value of 0 on the y-axis corresponds to a value of 0.5 on the x-axis (no change, relative to wild type). Scales on the y-axis have been adjusted to show, for each plot, the full data set. The lines represent the best fits of the data to linear functions. For each plot, the name of the algorithm used is reported, as well as the absolute value of the Pearson linear correlation coefficient (r) and the statistical significance of the slope (p).
Figure 3
Figure 3
Correlation between the change in aggregation propensity observed in vivo and the change in aggregation propensity predicted in silico by algorithms. For each algorithm and each data set, the absolute value of the Pearson linear correlation coefficient (r) is reported as both a numeric value and a horizontal bar.
Figure 4
Figure 4
Correlation between computational predictions and disease manifestations in higher organisms. (A–D) Correlation between relative longevity (Stox) and relative locomotor ability (Mtox) of Drosophila melanogaster strains overexpressing variants of Aβ42, and propensity of the overexpressed variants to form amyloid fibrils (A,B) or protofibrils (C,D). Following the original definition, high values of Stox and Mtox correspond to low values of longevity and locomotor ability, respectively. Adapted with permission from Luheshi et al, 2007. (E,F) Correlation between disease duration of patients with fALS and aggregation propensity (E) or the sum of aggregation propensity and instability (F) of the variants of SOD1. Adapted with permission from Wang, Q. et al, 2008. The algorithms used for the calculation are indicated in each graph. The r and p values reported for each graph are those indicated by the original authors. SOD1, superoxide dismutase 1.

References

    1. Bejarano E, Cuervo AM (2010) Chaperone-mediated autophagy. Proc Am Thorac Soc 7: 29–39 - PMC - PubMed
    1. Bryan AW, Menke M, Cowen LJ, Lindquist SL, Berger B (2009) BETASCAN: probable β-amyloids identified by pairwise probabilistic analysis. PLoS Comput Biol 5: e1000333. - PMC - PubMed
    1. Carrió M, González-Montalbán N, Vera A, Villaverde A, Ventura S (2005) Amyloid-like properties of bacterial inclusion bodies. J Mol Biol 347: 1025–1037 - PubMed
    1. Cherny I, Gazit E (2008) Amyloids: not only pathological agents but also ordered nanomaterials. Angew Chem Int Ed Engl 47: 4062–4069 - PubMed
    1. Chiti F, Dobson CM (2006) Protein misfolding, functional amyloid, and human disease. Annu Rev Biochem 75: 333–366 - PubMed