. 2011 Oct 1;519(14):2713-33.
doi: 10.1002/cne.22703.

Retinal remodeling in the Tg P347L rabbit, a large-eye model of retinal degeneration

Affiliations

Retinal remodeling in the Tg P347L rabbit, a large-eye model of retinal degeneration

B W Jones et al. J Comp Neurol. .

Abstract

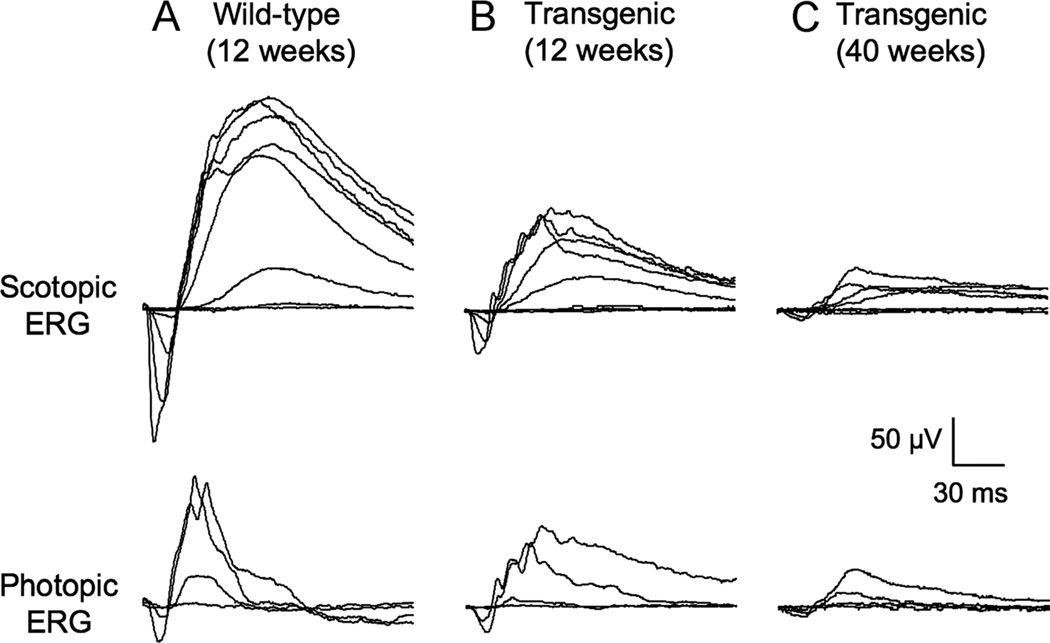
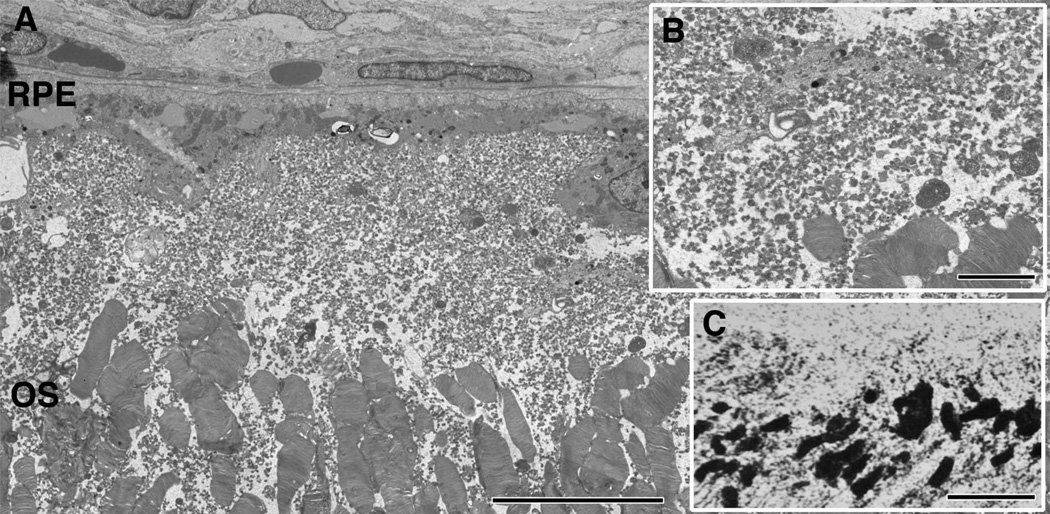
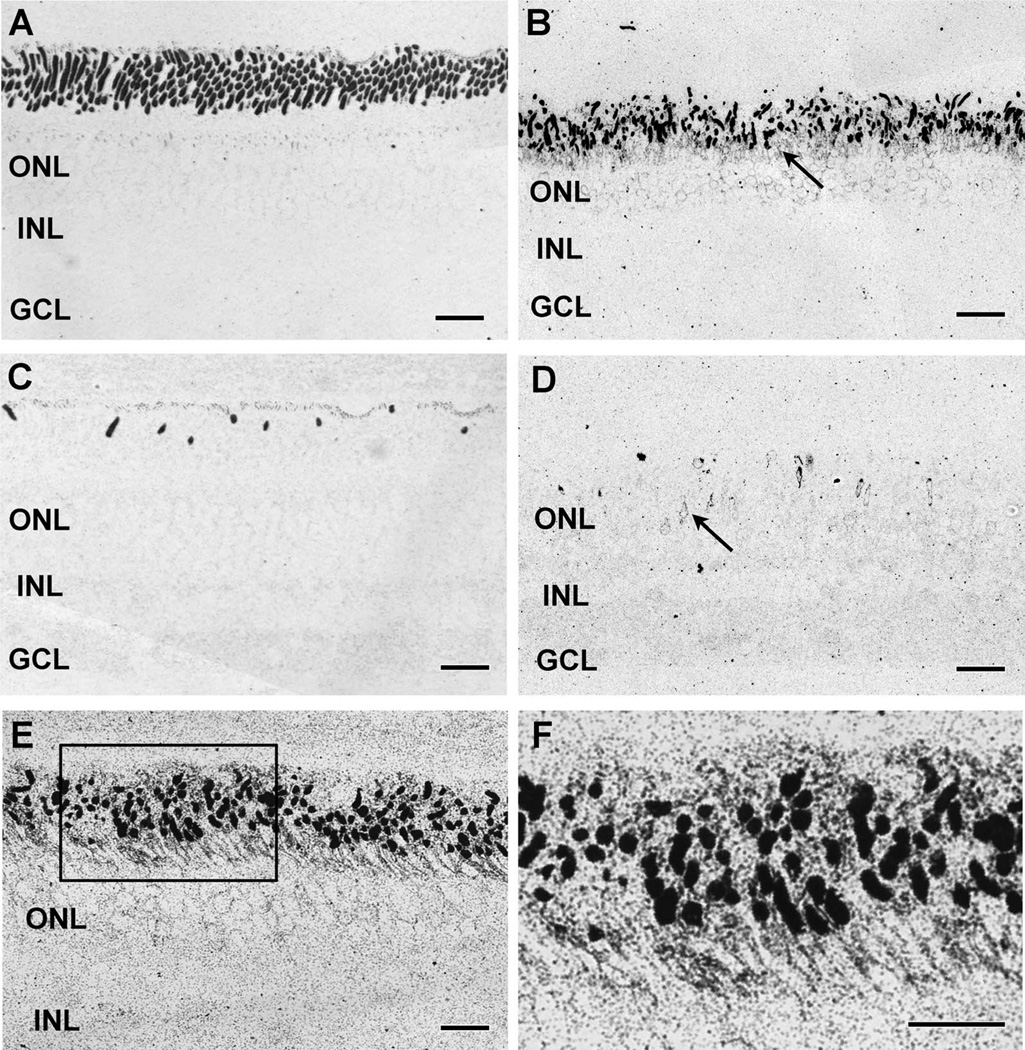
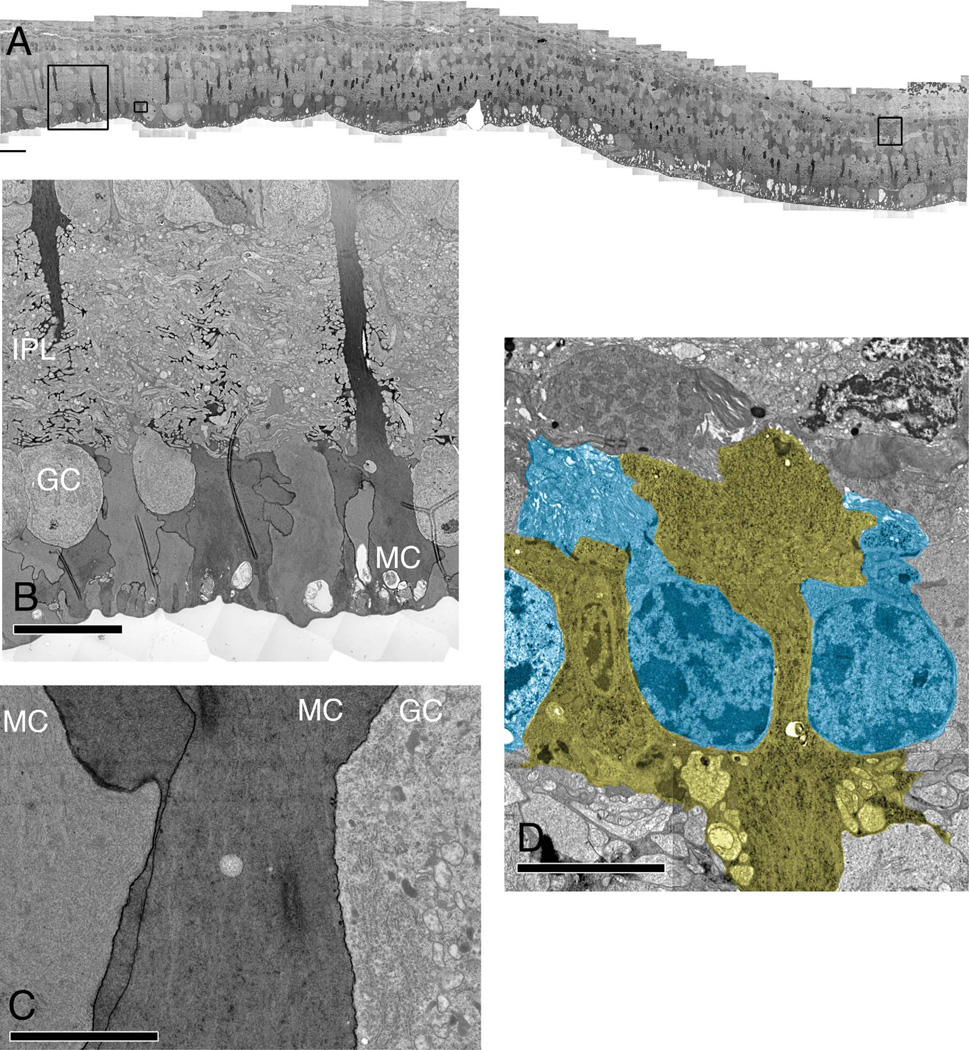
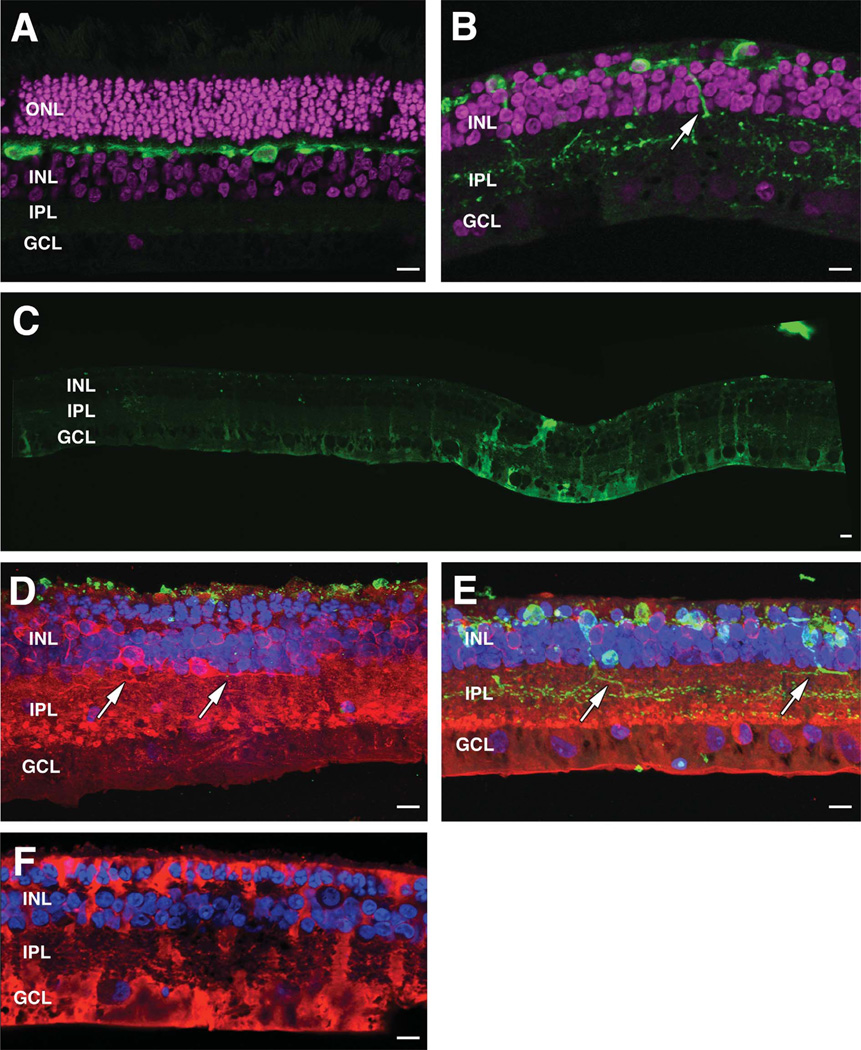
Retinitis pigmentosa (RP) is an inherited blinding disease characterized by progressive loss of retinal photoreceptors. There are numerous rodent models of retinal degeneration, but most are poor platforms for interventions that will translate into clinical practice. The rabbit possesses a number of desirable qualities for a model of retinal disease including a large eye and an existing and substantial knowledge base in retinal circuitry, anatomy, and ophthalmology. We have analyzed degeneration, remodeling, and reprogramming in a rabbit model of retinal degeneration, expressing a rhodopsin proline 347 to leucine transgene in a TgP347L rabbit as a powerful model to study the pathophysiology and treatment of retinal degeneration. We show that disease progression in the TgP347L rabbit closely tracks human cone-sparing RP, including the cone-associated preservation of bipolar cell signaling and triggering of reprogramming. The relatively fast disease progression makes the TgP347L rabbit an excellent model for gene therapy, cell biological intervention, progenitor cell transplantation, surgical interventions, and bionic prosthetic studies.


Conflict of interest statement

CONFLICT OF INTEREST

Robert E. Marc is a principal of Signature Immunologics.

Figures

Figure 1
Figure 1
AC: Electroretinograms (ERGs) recorded from 12-week-old wild-type (A) and 12- (B) and 40-week-old (C) TgP347L transgenic rabbits. Upper trace: scotopic ERGs elicited by eight different stimulus intensities ranging from −4.8 to 2.2 log cd s m−2. Lower trace: photopic ERGs elicited by four different stimulus intensities ranging from −0.8 to 2.2 log cd s m−2 on a rod-suppressing white background of 1.3 log cd m−2.
Figure 2
Figure 2
TEM of the subretinal space in a 16-week TgP347L rabbit. A: Debris in the subretinal space composed of 40–300-nm vesicles (inset B) above and in between the photoreceptor outer segments (OS). The vesicles are immunoreactive for rod opsin in and around the existing photoreceptor outer segments (inset C). For abbreviations, see list. Scale bar = 10 µm in A,C; 2.0 µm in B.
Figure 3
Figure 3
Opsin immunoreactivity. A,B: Rod opsin in (A) control and (B) 12-week TgP347L rabbit retinas. The TgP347L rod outer segments are shorter and disorganized, and show substantial rod opsin mislocalization to the inner segments (arrow). C,D: LWS opsin in (C) control and (D) 12-week TgP347L rabbit retinas. Cone outer segments are sparse and spot-like in the TgP347L animals and show mislocalization to the inner segments and cone photoreceptor cell bodies (arrow). E: Rod opsin debris in a 16-week TgP347L rabbit retina demonstrating fine ~20-40-nm-diameter particulate rod opsin. F: Magnified view of inset box in E shows rod opsin in the outer segments as well as delocalized rod opsin in the inner segments and membrane surrounding the photoreceptor cell bodies. For abbreviations, see list. Scale bar = 20 µm in A–D; 30 µm in E,F.
Figure 4
Figure 4
TEM of the TgP347L rabbit retina at 40 weeks. A: Image mosaic of over 5,000 individual EM images, each at 5,000× magnification, 2.18 nm/pixel. The dark Müller cell profiles represent regional fluctuations in polyribosome and protein upregulation. B: An enlarged region of A demonstrating the variation in polyribosome upregulation. Note the strong variation in density of neighboring Müller cell end-feet (MC). C: An enlarged region of A illustrating increased cytosolic polyribosome content in MCs next to a ganglion cell (GC) as well as enhanced protein content in the cell membrane of the MC. D: Müller cell seal formation between remnant photoreceptor cells (blue). For abbreviations, see list. Scale bar = 40 µm in A; 20 µm in B; 10 µm in C,D.
Figure 5
Figure 5
CMP of 16-week old TgP347 rabbit retina. A–H: (A) taurine, (B) glutamine, (C) glutamate, (D) glutathione, (E) GABA, (F) glycine, (G) AGB, and (H) γGE ∷ rgb mapping. Arrows in D indicate Müller cell end feet with varying glutathione levels. Inset in E shows amacrine cell neurite in the outer plexiform layer. Arrows in G show permeation of AGB into photoreceptors. For abbreviations, see list. Scale bar = 30 µm in A–H.
Figure 6
Figure 6
CMP of 40-week old TgP347L rabbit retina. A: Taurine. Arrows indicate small taurine+ survivor cones at the border between the RPE and the Müller cell seal (MCS). B: L-glutamine. Glutamine signals are elevated in Müller cells that form the distal seal. Presumed macro-phages show high concentrations of glutamine (box). C: L-glutamate. Reduced numbers of glutamate+ bipolar cells suggest cell death. D: Glutathione. Müller cells show variability in glutathione levels (oval). Presumed macrophages show high concentrations of glutamine (box). E: GABA. Increased GABA expression in Müller cells and anomalous neurites from GABAergic amacrine cells running underneath the Müller cell seal (rectangle). F: Glycine. G: γGE ∷ rgb visualizes photoreceptor, bipolar cell, GABA+ and glycine+ amacrine cells and ganglion cell superclasses. H: τQE ∷ rgb visualizes retinal pigmented epithelium and Müller cells. Three surviving cones (arrows) protrude above the Müller cell seal. Variation in the Müller cell signatures is evident (oval). For abbreviations, see list. Scale bar = 30 µm in A–H.
Figure 7
Figure 7
Refined theme map derived from clustering of Müller cells in the 12-week TgP347L Tg rabbit overlaid on the taurine channel revealing three separate metabolic classes in Müller cells representing distinct pathological metabolic states. For abbreviations, see list. Scale bar = 30 µm.
Figure 8
Figure 8
A: τQE ∷ rgb visualization in the TgP347L rabbit retina. The Müller cell seal in this region is almost complete. Four to five remnant cone photoreceptors are evident along with a presumed macrophage (to the right of the asterisk). Isolated surviving cones can be observed embedded in a well-formed Müller cell seal (arrows). B: Altered Müller cell signatures (oval) are observed in both the TgP347L rabbit (A) and in the ad Human RP retina, in which formation of the Müller cell seal is not complete. Instead, alterations in Müller cell signatures are present along with hypertrophy of Müller cell processes in and around the remnant photoreceptors. C,D: γ-Aminobutyric acid (GABA) labeling in the TgP347L rabbit retina (C) and human adRP retina (D) with sprouting of amacrine cell processes observed outside of the normal lamination of the IPL (box). E,F: γGE ∷ rgb visualization of the rabbit 347L (E) and human adRP (F) retinas demonstrating photoreceptor, bipolar cell, GABA+, and glycine+ amacrine cells and ganglion cell superclasses. Sprouting of both GABA+ and glycine+ amacrine cell processes can be visualized in the red and green channels with processes from both cell superclasses appearing outside their normal lamination. Scale bar = 30 µm in A–F.
Figure 9
Figure 9
Confocal microscopy of WT and 40-week TgP347L retinas. A,B: DAPI (magenta) + calbindin (green) images from wild-type retina (A) and DAPI (magenta) + calbindin (green) images from TgP347L rabbit (B) demonstrating horizontal cell remodeling in the degenerate retina. C: Mosaiced GS expression in TgP347L retina. D: Maximal projection image of PKC (red), Rho 1D4 (green), and DAPI (blue) demonstrating reduced rhodopsin immunoreactivity and new rod bipolar cell axons projecting along the border of the IPL (arrows). E: Maximal projection image of PKC (red), calbindin (green), and DAPI (blue) demonstrating calbindin labeling in horizontal cells with altered PKC expression. Horizontal cell processes project into the IPL (arrows). F: CRALBP immunostaining of Müller cells demonstrating glial hypertrophy and envelopment of remnant bipolar cells and photoreceptors, forming the intial Müller cell seal. For abbreviations, see list. Scale bar = 10 µm in A–F.
Figure 10
Figure 10
Excitation mapping. Each panel is a triplet of γGE ∷ rgb mapping (left), τBE ∷ rgb mapping where B (green) is the AGB excitation signal generated by 25 µm KA (middle), and a theme map of cell classes (right). Key: light blue, ganglion cells; bright red, GABAergic amacrine cells; bright green, glycinergic amacrine cells; dark red, OFF bipolar cells; olive green, ON cone bipolar cells; dark blue, rod bipolar cells; tan, horizontal cells. A: Wild-type rabbit. B: A 12-week TgP347L rabbit. C: A 40-week TgP347L rabbit. D,E: Horizontal sections through the bipolar cell layer of (D) wild-type and (E) 40-week TgP347L rabbit retinas visualized with GBE ∷ rgb mapping demonstrating that 56% of the remaining bipolar cells are AGB responsive. F: Scaled univariate butterfly histograms of KA-activated bipolar cell signals for wild-type type rabbit and 40-week old TgP347L rabbit retinas. Left wing (wild-type rabbit): OFF bipolar cells (pale blue) comprise 37% and nonresponsive ON cone and rod bipolar cells (pale blue and red striped) comprise 63% of all bipolar cells in normal peripheral primate retina. Right wing (40-week TgP347L rabbit): OFF bipolar cells (pale blue) comprise 56% and nonresponsive ON cone bipolar cells (tan) comprise 43% of all remaining bipolar cells in the dystrophic retina. Rod bipolar cells (red) comprise 1% of the remnant cells. For abbreviations, see list. Scale bar = 20 µm in A–E.
Figure 11
Figure 11
Theme maps of horizontal sections through ONL. AC: KA-driven (25 µm) signaling in (A) wild-type, (B) 12-week TgP347L rabbit, and (C) 40-week TgP347L rabbit retinas clustered and segmented through computational molecular phenotyping (CMP). Cell classes include rod bipolar cells (light blue), ON cone bipolar cells (light red), OFF cone bipolar cells (green), glycinergic amacrine cells (dark blue), GABAergic amacrine cells (dark red), and horizontal cells (orange). Müller cells are black. Scale bar = 30 µm in A–C.

Similar articles

Cited by

References

    1. Acland GM, Aguirre GD, Ray J, Zhang Q, Aleman TS, Cideciyan AV, Pearce-Kelling SE, Anand V, Zeng Y, Maguire AM, Jacobson SG, Hauswirth WW, Bennett J. Gene therapy restores vision in a canine model of childhood blindness. Nat Genet. 2001;28:92–95. - PubMed
    1. Alfinito PD, Townes-Anderson E. Activation of mislocalized opsin kills rod cells: a novel mechanism for rod cell death in retinal disease. Proc Natl Acad Sci U S A. 2002;99:5655–5660. - PMC - PubMed
    1. Anderson DH, Neitz J, Saari JC, Kaska DD, Fenwick J, Jacobs GH, Fisher SK. Retinoid-binding proteins in cone-dominant retinas. Invest Ophthalmol Vis Sci. 1986;27:1015–1026. - PubMed
    1. Anderson JR, Jones BW, Yang J-H, Shaw MV, Watt CB, Koshevoy P, Spaltenstein J, Jurrus E, Uv K, Whitaker RT, Mastronarde D, Tasdizen T, Marc RE. A computational framework for ultrastructural mapping of neural circuitry. PLoS Biol. 2009;7:e1000074. - PMC - PubMed
    1. Baehr W, Frederick JM. Naturally occurring animal models with outer retina phenotypes. Vision Res. 2009;49:2636–2652. - PMC - PubMed

Publication types

MeSH terms