. 2011 Oct;26(10):2498-510.
doi: 10.1002/jbmr.443.

Smad6 is essential to limit BMP signaling during cartilage development

Affiliations

Smad6 is essential to limit BMP signaling during cartilage development

Kristine D Estrada et al. J Bone Miner Res. 2011 Oct.

Abstract

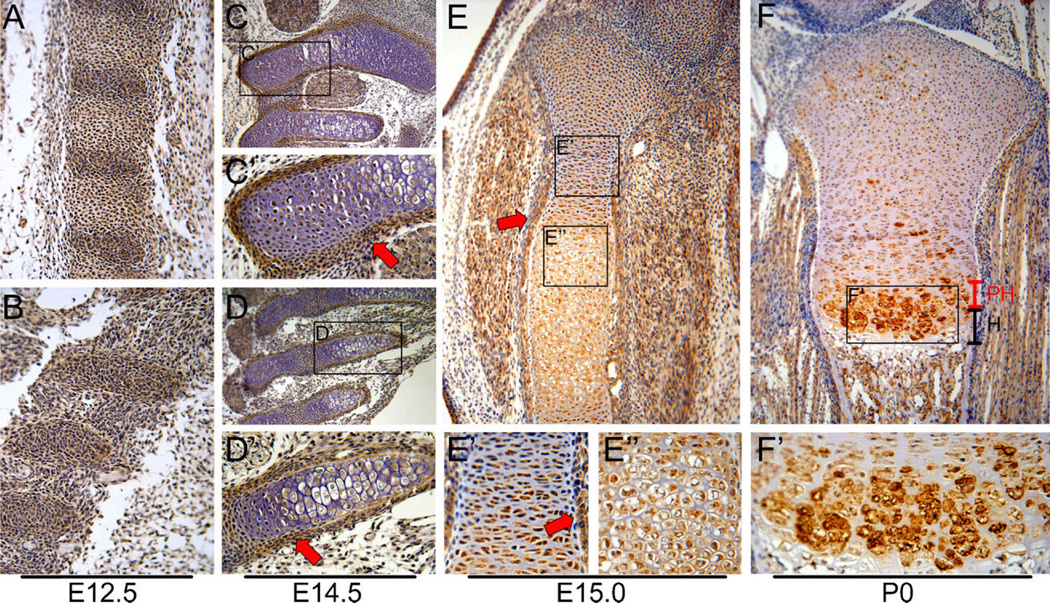
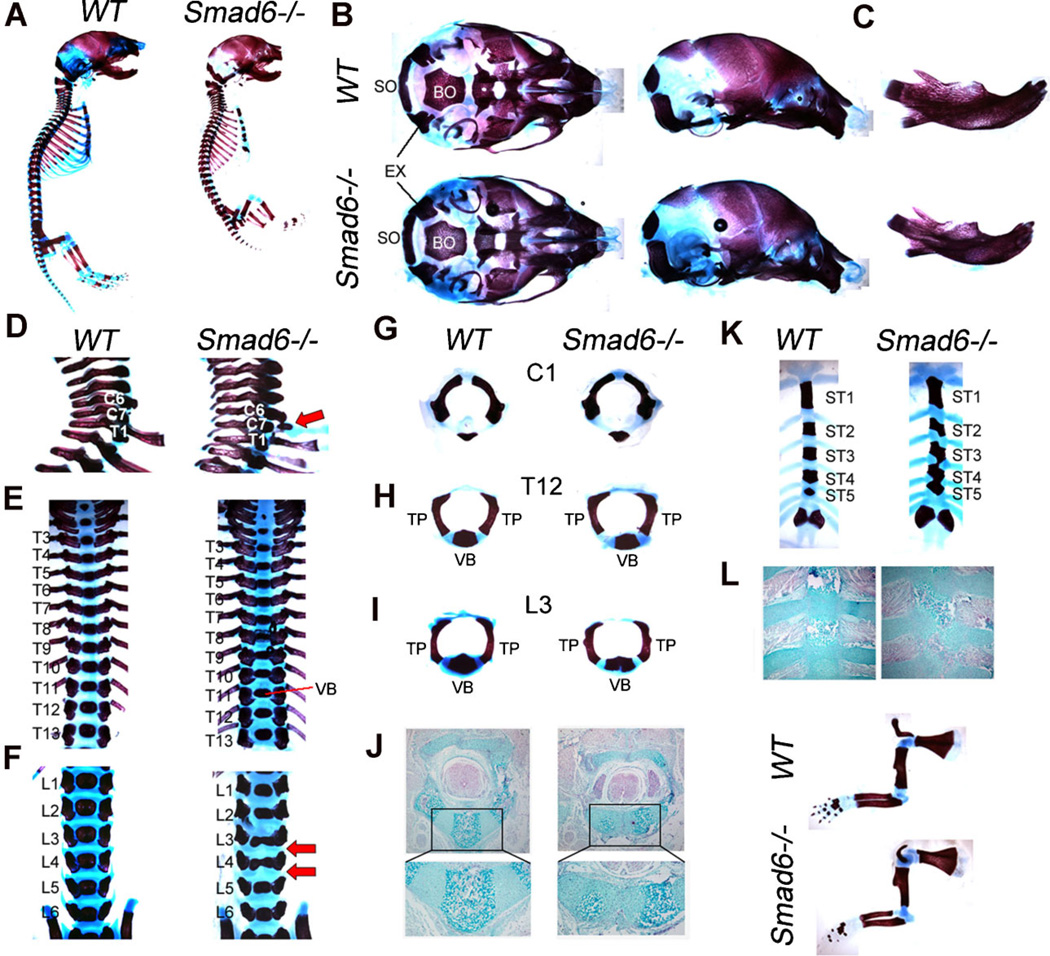
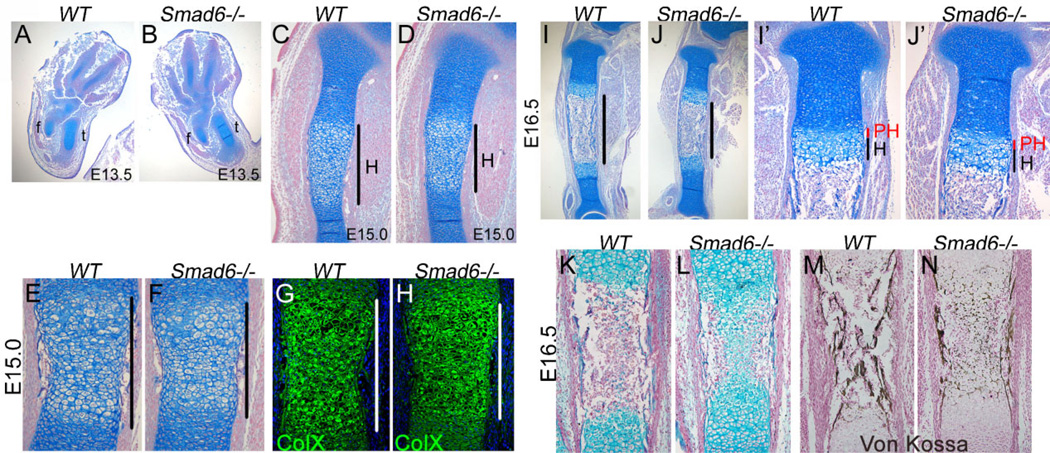
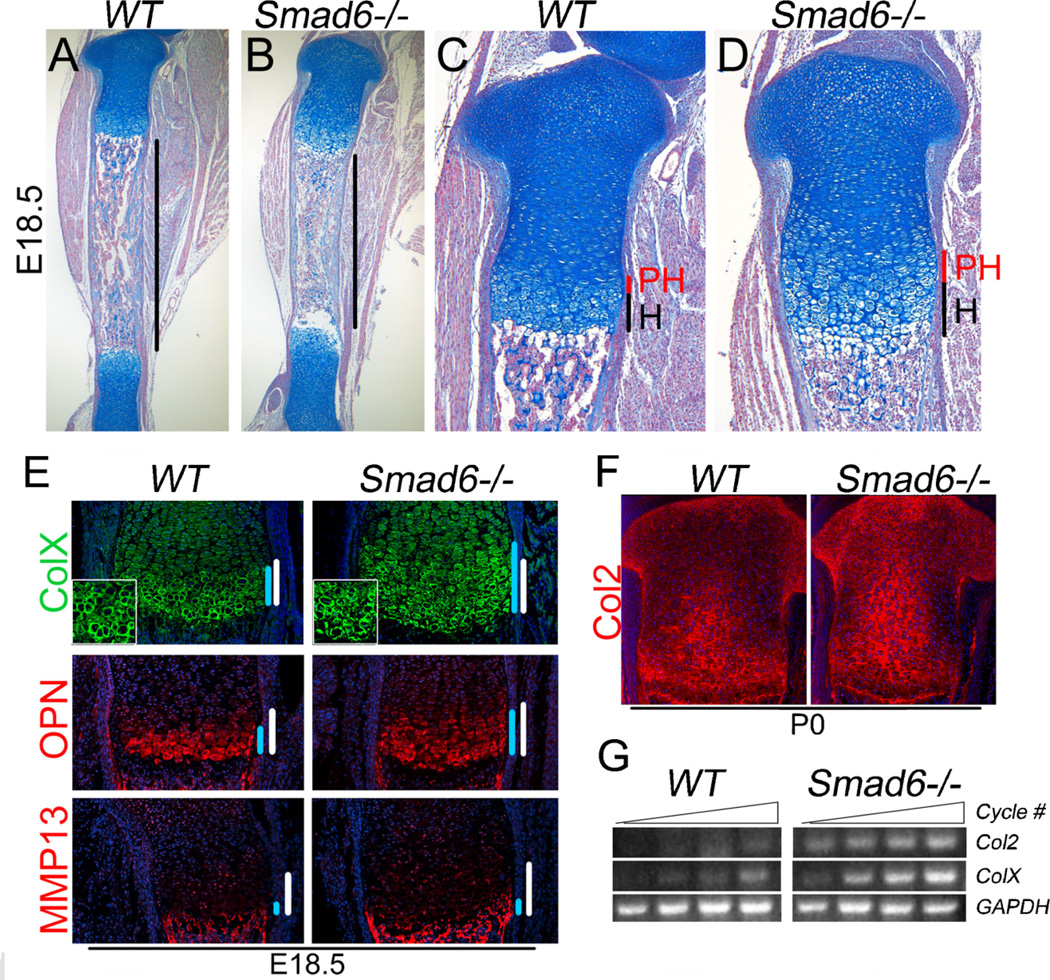
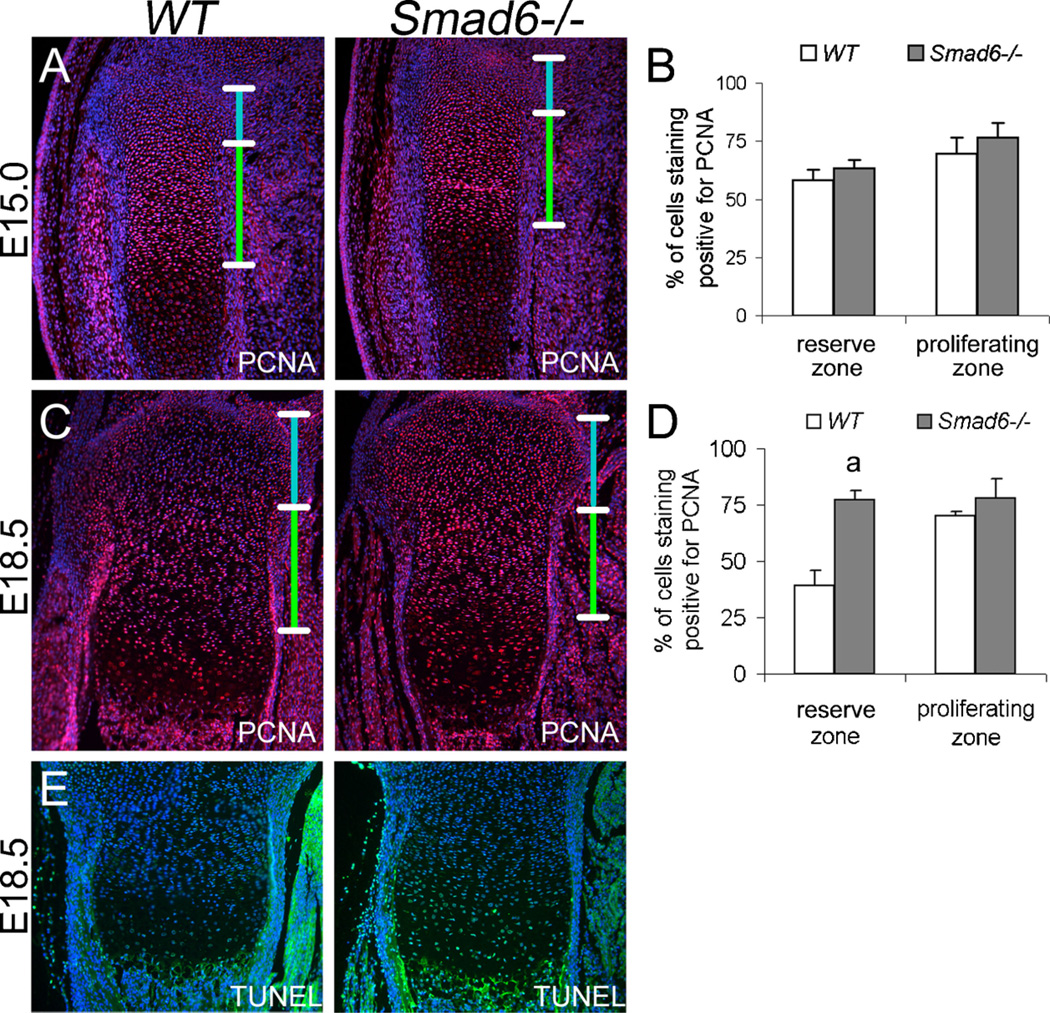
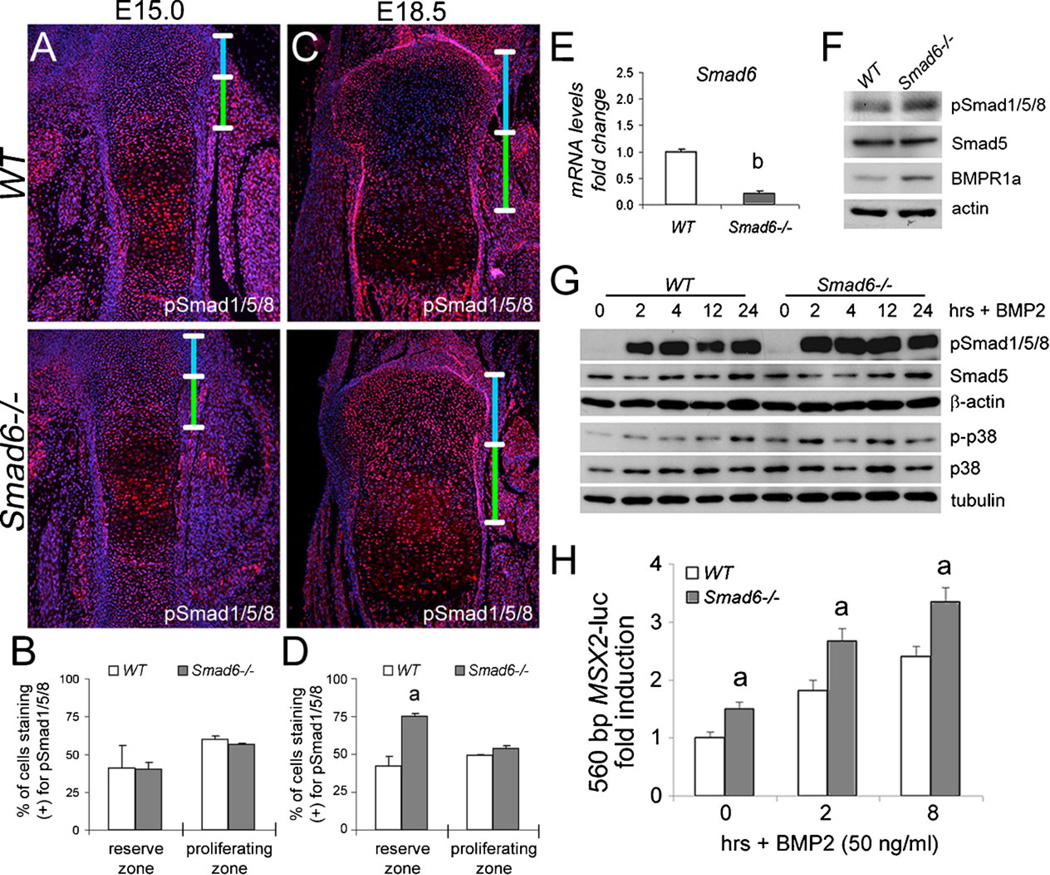
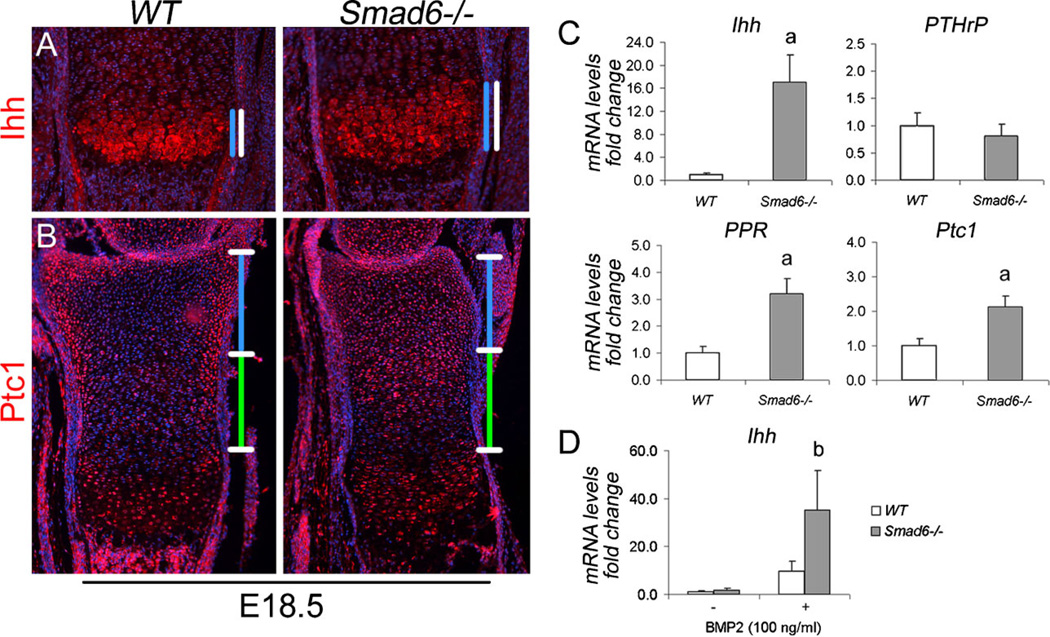
Bone morphogenetic protein (BMP) signaling pathways regulate multiple aspects of endochondral bone formation. The importance of extracellular antagonists as regulators of BMP signaling has been defined. In vitro studies reveal that the intracellular regulators, inhibitory Smads 6 and 7, can regulate BMP-mediated effects on chondrocytes. Although in vivo studies in which inhibitory Smads were overexpressed in cartilage have shown that inhibitory Smads have the potential to limit BMP signaling in vivo, the physiological relevance of inhibitory Smad activity in skeletal tissues is unknown. In this study, we have determined the role of Smad6 in endochondral bone formation. Loss of Smad6 in mice leads to defects in both axial and appendicular skeletal development. Specifically, Smad6-/- mice exhibit a posterior transformation of the seventh cervical vertebra, bilateral ossification centers in lumbar vertebrae, and bifid sternebrae due to incomplete sternal band fusion. Histological analysis of appendicular bones revealed delayed onset of hypertrophic differentiation and mineralization at midgestation in Smad6-/- mice. By late gestation, however, an expanded hypertrophic zone, associated with an increased pool of proliferating cells undergoing hypertrophy, was evident in Smad6 mutant growth plates. The mutant phenotype is attributed, at least in part, to increased BMP responsiveness in Smad6-deficient chondrocytes. Overall, our results show that Smad6 is required to limit BMP signaling during endochondral bone formation.


Conflict of interest statement

Conflicts of Interest The authors have no conflict of interest.

Figures

Figure 1
Figure 1
Smad6 localization in cartilage during development. Immunohistochemistry of sagittal sections of wild-type embryos at E12.5 for Smad6 (brown color) demonstrates expression in (A) developing vertebral bodies and intervertebral discs of lumbar vertebrae and (B) developing anterior ribs. Staining of sagittal sections at E14.5 shows Smad6 expression in (C) cervical vertebrae and (D) anterior ribs. Higher magnification of the (C’) lateral region of C1 and (D’) 2nd rib shows Smad6 expression in the growth plate and perichondrium (red arrows). (E) Smad6 expression in tibiae at E15.0. (E’) Smad6 is localized in the cytoplasm and nucleus of proliferative cells at E15.0. Smad6 is also expressed in the perichondrium (red arrow) (E”) Smad6 is localized in the cytoplasm of hypertrophic cells at E15.0. (F) By postnatal day 0 (P0), Smad6 levels are highest in the prehypertrophic and upper hypertrophic zones of the tibial growth plate. (F’) Smad6 is localized in both the cytoplasm and the peripheral cell membrane of hypertrophic cells. For all stains, no detectable staining was observed in controls, from which primary antibodies were omitted. PH, prehypertrophic; H, hypertrophic zone.
Figure 2
Figure 2
Skeleton defects in Smad6−/− mice at P0. (A) Whole mount skeletal preparations of wildtype (WT) and Smad6−/− P0 embryos. (B) Basal (left) and lateral (right) view of skull. Mandibles and hyoid bones have been removed. (C) Lateral view of mandibles. (D) Lateral view of cervical vertebrae. Red arrow highlights rib indicative of posterior transformation of the seventh cervical vertebra in mutants. (E) Dorsal view of thoracic vertebrae. (F) Dorsal view of lumbar vertebrae. Red arrows highlight rounded intervertebral discs in mutants. Split vertebral bodies are evident in L3 and L4 of mutants. (G) Anterior view of C1. (H) Anterior view of T12. (I) Anterior view of L3 shows a split vertebral body in mutants. (J) Alcian blue staining of lumbar vertebra shows bilateral ossification centers in mutants, presumably as a result of incomplete fusion of somite pairs. (K) Dorsal view of sternum shows bifid sternebrae and fused ST3, ST4 and ST5 in mutants. (L) Alcian blue staining of sternum shows defects in sternal band fusion in Smad6−/− mice. (M) Forelimbs of WT and Smad6−/− embryos at P0. EX, exoccipital; BO, basioccipital bone; SO, supraoccipital; TP, transverse process; VB, vertebral body.
Figure 3
Figure 3
Delayed onset of hypertrophic differentiation and mineralization at midgestation in Smad6−/− mice. (A,B) Formation of cartilage condensations in Smad6−/− limbs is similar to that in wild-type (WT) limbs at E13.5. (C,D) A shorter hypertrophic zone is evident in the Smad6−/− tibiae at E15.0. (E,F) Alcian blue staining of E15.0 femoral diaphyses. The hypertrophic zone in Smad6−/− mice is demarcated by black bars. (G,H) Immunofluorescence staining for type X collagen of E15.0 femurs. The hypertrophic zone is demarcated by white bars. No detectable staining was observed in negative controls, from which primary antibodies were omitted. (I,J) Shorter diaphyses are evident in the E16.5 Smad6−/− tibiae, as demarcated by black bars. (I’,J’) Higher magnification of proximal tibias at E16.5. (K,L) Alcian blue staining of E16.5 tibial diaphyses. (M,N) Von Kossa staining of E16.5 tibias shows defects in mineralization in Smad6−/− mice. f, fibula; t, tibia; PH, prehypertrophic zone; H, hypertrophic zone.
Figure 4
Figure 4
Enhanced hypertrophic differentiation at late gestation in Smad6−/− mice. (A,B) Shorter diaphyses are evident in E18.5 Smad6−/− tibias, as demarcated by black bars. (C,D) Higher magnification of proximal tibias at E18.5. (E) Immunofluorescence staining of adjacent sections of E18.5 distal femurs for the hypertrophic differentiation marker, type X collagen, and terminal differentiation markers, osteopontin (OPN) and MMP-13. The hypertrophic zone is demarcated by white bars. The region of expression is demarcated by blue bars. No detectable staining was observed in negative controls, from which primary antibodies were omitted. (F) Immunofluorescence staining of tibial growth plates for type II collagen shows enhanced collagen production at P0. No detectable staining was observed in negative controls. (G) Semiquantitative RT-PCR analysis of RNA isolated from WT and Smad6−/− primary chondrocytes cultured in chondrogenic media for 7 days.
Figure 5
Figure 5
Increased proliferation and apoptosis at late gestation in Smad6−/− mice. (A) Immunofluorescence staining of E15.0 proximal tibiae for the proliferation marker, PCNA. The reserve and proliferative zones are demarcated by blue and green bars, respectively. No detectable staining was observed in negative controls, from which primary antibodies were omitted. (B) Quantification of the rates of proliferation in wild-type and mutant cells at E15.0. Values are expressed as percent labeled cells. (C) Immunofluorescence staining of E18.5 proximal tibiae for PCNA. The reserve and proliferative zones are demarcated by blue and green bars, respectively. (D) Quantification of the rates of proliferation in wild-type and mutant cells at E18.5. Values are expressed as percent labeled cells (Student’s t-test; ap < 0.05). (E) TUNEL staining of E18.5 proximal tibiae. No detectable staining was observed in negative controls.
Figure 6
Figure 6
Increased BMP signaling in Smad6−/− chondrocytes. Immunofluorescence staining of (A) E15.0 distal femurs and (C) E18.5 proximal tibiae for phosphorylated forms of Smad1/5/8 (pSmad1/5/8). The reserve and proliferative zones are demarcated by blue and green bars, respectively. No detectable staining was observed in negative controls, from which primary antibodies were omitted. Quantification of pSmad1/5/8 staining in wild-type and mutant cells at (B) E15.0 and (D) E18.5. Values are expressed as percent labeled cells (Student’s t-test; ap < 0.05). (E) Real-time PCR analysis of RNA isolated from WT and Smad6−/− primary chondrocytes cultured in chondrogenic media. Expression levels for Smad6 were normalized to β-actin and are shown as fold change relative to WT mRNA levels. The data represent averages from triplicate reactions with the indicated s.d. and significant differences (Student’s t-test; bp < 0.001). (F) Western blot analysis of pSmad1/5/8 and BMPR1a levels in lysates isolated from WT and Smad6−/− primary chondrocytes cultured in chondrogenic media for 10 days. (G) Western blot analysis shows elevated levels of pSmad1/5/8 and phospho-p38 (p-p38) in lysates isolated from WT and Smad6−/− primary chondrocytes treated with BMP2 (50 ng/ml) for 0, 2, 4, 12, or 24 hours. (H) BMP2 induction of the 560 bp MSX2-luc promoter is enhanced in Smad6−/− primary chondrocytes. Cells were treated with BMP2 (50 ng/ml) for 0, 2, or 8 hours. The data represent an average from three wells with the indicated s.d. and significant differences (multifactorial ANOVA (Within-subjects); ap < 0.05 versus wild-type control).
Figure 7
Figure 7
Loss of Smad6 leads to Increased Ihh expression and activity in chondrocytes. (A) Immunofluorescence staining of E18.5 distal tibiae for Ihh. The prehypertrophic and hypertrophic zones are demarcated by white bars. The region of expression is demarcated by blue bars. (B) Immunofluorescence staining of E18.5 distal tibiae for patched1 (Ptc1). The reserve and proliferative zones are demarcated by blue and green bars, respectively. No detectable staining was observed in negative controls, from which primary antibodies were omitted. (C) Real-time PCR analysis of RNA isolated from WT and Smad6−/− primary chondrocytes cultured for 10 days in chondrogenic media. Expression levels for each gene of interest were normalized to β-actin and are shown as fold change relative to WT mRNA levels. The data represent averages from triplicate reactions with the indicated s.d. and significant differences (Student’s t-test; ap < 0.001). (D) Realtime PCR analysis of RNA isolated from WT and Smad6−/− primary chondrocytes cultured in chondrogenic media for 10 days, serum-starved overnight, and then treated with BMP2 (100 ng/ml) for 2 hours. Ihh mRNA levels were normalized to β-actin and are shown as fold change relative to WT mRNA levels. The data represent averages from triplicate reactions with the indicated s.d. and significant differences (Student’s t-test; bp < 0.05).

References

    1. Kronenberg HM. Developmental regulation of the growth plate. Nature. 2003;423(6937):332–336. - PubMed
    1. Zehentner BK, Dony C, Burtscher H. The transcription factor Sox9 is involved in BMP-2 signaling. J Bone Miner Res. 1999;14(10):1734–1741. - PubMed
    1. Pan Q, Yu Y, Chen Q, Li C, Wu H, Wan Y, Ma J, Sun F. Sox9, a key transcription factor of bone morphogenetic protein-2-induced chondrogenesis, is activated through BMP pathway and a CCAAT box in the proximal promoter. J Cell Physiol. 2008;217(1):228–241. - PubMed
    1. Valcourt U, Gouttenoire J, Moustakas A, Herbage D, Mallein-Gerin F. Functions of transforming growth factor-beta family type I receptors and Smad proteins in the hypertrophic maturation and osteoblastic differentiation of chondrocytes. J Biol Chem. 2002;277(37):33545–33558. - PubMed
    1. Minina E, Wenzel HM, Kreschel C, Karp S, Gaffield W, McMahon AP, Vortkamp A. BMP and Ihh/PTHrP signaling interact to coordinate chondrocyte proliferation and differentiation. Development. 2001;128(22):4523–4534. - PubMed

Publication types