

Separating brain processing of pain from that of stimulus intensity
- PMID: 21681856
- PMCID: PMC6869957
- DOI: 10.1002/hbm.21256
Separating brain processing of pain from that of stimulus intensity
Abstract
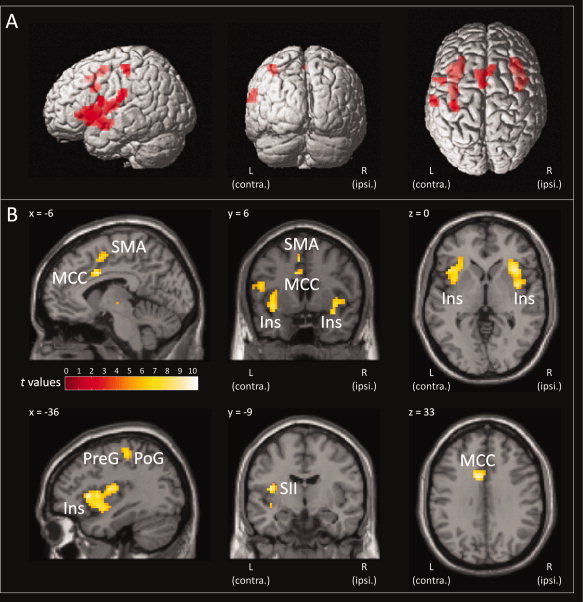
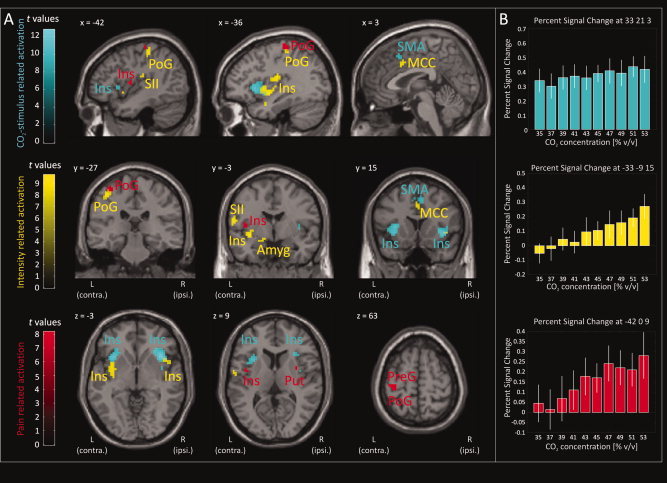
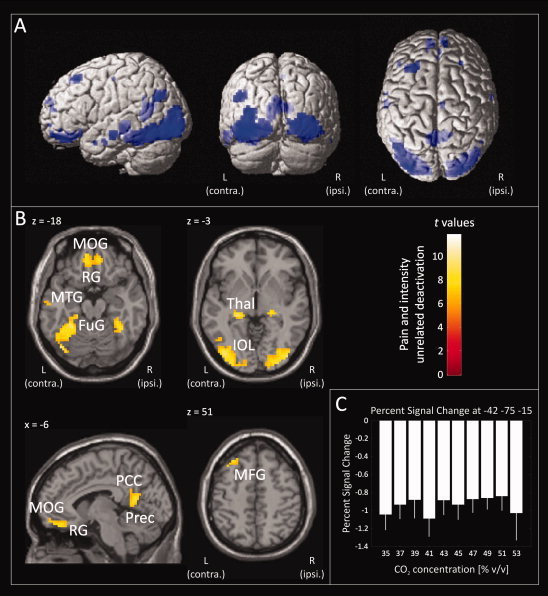
Regions of the brain network activated by painful stimuli are also activated by nonpainful and even nonsomatosensory stimuli. We therefore analyzed where the qualitative change from nonpainful to painful perception at the pain thresholds is coded. Noxious stimuli of gaseous carbon dioxide (n = 50) were applied to the nasal mucosa of 24 healthy volunteers at various concentrations from 10% below to 10% above the individual pain threshold. Functional magnetic resonance images showed that these trigeminal stimuli activated brain regions regarded as the "pain matrix." However, most of these activations, including the posterior insula, the primary and secondary somatosensory cortex, the amygdala, and the middle cingulate cortex, were associated with quantitative changes in stimulus intensity and did not exclusively reflect the qualitative change from nonpainful to pain. After subtracting brain activations associated with quantitative changes in the stimuli, the qualitative change, reflecting pain-exclusive activations, could be localized mainly in the posterior insular cortex. This shows that cerebral processing of noxious stimuli focuses predominately on the quantitative properties of stimulus intensity in both their sensory and affective dimensions, whereas the integration of this information into the perception of pain is restricted to a small part of the pain matrix.
Copyright © 2011 Wiley Periodicals, Inc.
Figures
Similar articles
-
The human operculo-insular cortex is pain-preferentially but not pain-exclusively activated by trigeminal and olfactory stimuli.PLoS One. 2012;7(4):e34798. doi: 10.1371/journal.pone.0034798. Epub 2012 Apr 5. PLoS One. 2012. PMID: 22496865 Free PMC article.
-
Expectation of pain enhances responses to nonpainful somatosensory stimulation in the anterior cingulate cortex and parietal operculum/posterior insula: an event-related functional magnetic resonance imaging study.J Neurosci. 2000 Oct 1;20(19):7438-45. doi: 10.1523/JNEUROSCI.20-19-07438.2000. J Neurosci. 2000. PMID: 11007903 Free PMC article. Clinical Trial.
-
Multiple somatotopic representations of heat and mechanical pain in the operculo-insular cortex: a high-resolution fMRI study.J Neurophysiol. 2010 Nov;104(5):2863-72. doi: 10.1152/jn.00253.2010. Epub 2010 Aug 25. J Neurophysiol. 2010. PMID: 20739597 Free PMC article.
-
Functional imaging of brain responses to pain. A review and meta-analysis (2000).Neurophysiol Clin. 2000 Oct;30(5):263-88. doi: 10.1016/s0987-7053(00)00227-6. Neurophysiol Clin. 2000. PMID: 11126640 Review.
-
[Functional brain mapping of pain perception].Med Sci (Paris). 2011 Jan;27(1):82-7. doi: 10.1051/medsci/201127182. Med Sci (Paris). 2011. PMID: 21299967 Review. French.
Cited by
-
Low Back Pain Assessment Based on Alpha Oscillation Changes in Spontaneous Electroencephalogram (EEG).Neural Plast. 2021 Jul 1;2021:8537437. doi: 10.1155/2021/8537437. eCollection 2021. Neural Plast. 2021. PMID: 34306064 Free PMC article.
-
Psychophysically-anchored, Robust Thresholding in Studying Pain-related Lateralization of Oscillatory Prestimulus Activity.J Vis Exp. 2017 Jan 21;(119):55228. doi: 10.3791/55228. J Vis Exp. 2017. PMID: 28190048 Free PMC article.
-
Spatiotemporal Processing of Bimodal Odor Lateralization in the Brain Using Electroencephalography Microstates and Source Localization.Front Neurosci. 2021 Jan 13;14:620723. doi: 10.3389/fnins.2020.620723. eCollection 2020. Front Neurosci. 2021. PMID: 33519370 Free PMC article.
-
Some like it, some do not: behavioral responses and central processing of olfactory-trigeminal mixture perception.Brain Struct Funct. 2021 Jan;226(1):247-261. doi: 10.1007/s00429-020-02178-4. Epub 2020 Dec 23. Brain Struct Funct. 2021. PMID: 33355693 Free PMC article.
-
The human operculo-insular cortex is pain-preferentially but not pain-exclusively activated by trigeminal and olfactory stimuli.PLoS One. 2012;7(4):e34798. doi: 10.1371/journal.pone.0034798. Epub 2012 Apr 5. PLoS One. 2012. PMID: 22496865 Free PMC article.
References
-
- Apkarian AV, Gelnar PA, Krauss BR, Szeverenyi NM ( 2000): Cortical responses to thermal pain depend on stimulus size: a functional MRI study. J Neurophysiol 83: 3113–3122. - PubMed
-
- Apkarian AV, Bushnell MC, Treede RD, Zubieta JK ( 2005): Human brain mechanisms of pain perception and regulation in health and disease. Eur J Pain 9: 463–484. - PubMed
-
- Bingel U, Quante M, Knab R, Bromm B, Weiller C, Buchel C ( 2002): Subcortical structures involved in pain processing: evidence from single‐trial fMRI. Pain 99: 313–321. - PubMed
-
- Bingel U, Glascher J, Weiller C, Büchel C ( 2004): Somatotopic representation of nociceptive information in the putamen: An event‐related fMRI study. Cereb Cortex 14: 1340–1345. - PubMed
Publication types
MeSH terms
LinkOut - more resources
Full Text Sources
Medical
