Spatial tuning curves from apical, middle, and basal electrodes in cochlear implant users
- PMID: 21682414
- PMCID: PMC3135148
- DOI: 10.1121/1.3583503
Spatial tuning curves from apical, middle, and basal electrodes in cochlear implant users
Abstract
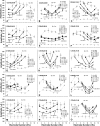
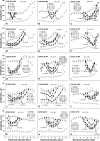
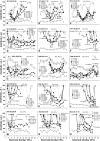
Forward-masked psychophysical spatial tuning curves (fmSTCs) were measured in 15 cochlear-implant subjects, 10 using monopolar stimulation and 5 using bipolar stimulation. In each subject, fmSTCs were measured at several probe levels on an apical, middle, and basal electrode using a fixed-level probe stimulus and variable-level maskers. Tuning curve slopes and bandwidths did not change significantly with probe level for electrodes located in the apical, middle, or basal region although a few subjects exhibited dramatic changes in tuning at the extremes of the probe level range. Average tuning curve slopes and bandwidths did not vary significantly across electrode regions. Spatial tuning curves were symmetrical and similar in width across the three electrode regions. However, several subjects demonstrated large changes in slope and/or bandwidth across the three electrode regions, indicating poorer tuning in localized regions of the array. Cochlear-implant users exhibited bandwidths that were approximately five times wider than normal-hearing acoustic listeners but were in the same range as acoustic listeners with moderate cochlear hearing loss. No significant correlations were found between spatial tuning parameters and speech recognition; although a weak relation was seen between middle electrode tuning and transmitted information for vowel second formant frequency.
© 2011 Acoustical Society of America
Figures


Similar articles
-
Rate and onset cues can improve cochlear implant synthetic vowel recognition in noise.J Acoust Soc Am. 2013 Mar;133(3):1546-60. doi: 10.1121/1.4789940. J Acoust Soc Am. 2013. PMID: 23464025 Free PMC article.
-
Consonant recognition as a function of the number of stimulation channels in the Hybrid short-electrode cochlear implant.J Acoust Soc Am. 2012 Nov;132(5):3406-17. doi: 10.1121/1.4757735. J Acoust Soc Am. 2012. PMID: 23145621 Free PMC article.
-
Forward-masked spatial tuning curves in cochlear implant users.J Acoust Soc Am. 2008 Mar;123(3):1522-43. doi: 10.1121/1.2836786. J Acoust Soc Am. 2008. PMID: 18345841 Free PMC article.
-
Development and evaluation of the Nurotron 26-electrode cochlear implant system.Hear Res. 2015 Apr;322:188-99. doi: 10.1016/j.heares.2014.09.013. Epub 2014 Oct 2. Hear Res. 2015. PMID: 25281795 Review.
-
Electroacoustic Stimulation.Otolaryngol Clin North Am. 2019 Apr;52(2):311-322. doi: 10.1016/j.otc.2018.11.008. Epub 2019 Jan 5. Otolaryngol Clin North Am. 2019. PMID: 30617011 Review.
Cited by
-
Vibro-Tactile Enhancement of Speech Intelligibility in Multi-talker Noise for Simulated Cochlear Implant Listening.Trends Hear. 2018 Jan-Dec;22:2331216518797838. doi: 10.1177/2331216518797838. Trends Hear. 2018. PMID: 30222089 Free PMC article.
-
Monopolar Detection Thresholds Predict Spatial Selectivity of Neural Excitation in Cochlear Implants: Implications for Speech Recognition.PLoS One. 2016 Oct 31;11(10):e0165476. doi: 10.1371/journal.pone.0165476. eCollection 2016. PLoS One. 2016. PMID: 27798658 Free PMC article.
-
Speech perception in tones and noise via cochlear implants reveals influence of spectral resolution on temporal processing.Trends Hear. 2014 Oct 13;18:2331216514553783. doi: 10.1177/2331216514553783. Trends Hear. 2014. PMID: 25315376 Free PMC article.
-
The Relationship Between Interaural Insertion-Depth Differences, Scalar Location, and Interaural Time-Difference Processing in Adult Bilateral Cochlear-Implant Listeners.Trends Hear. 2022 Jan-Dec;26:23312165221129165. doi: 10.1177/23312165221129165. Trends Hear. 2022. PMID: 36379607 Free PMC article.
-
Comparing Rapid and Traditional Forward-Masked Spatial Tuning Curves in Cochlear-Implant Users.Trends Hear. 2019 Jan-Dec;23:2331216519851306. doi: 10.1177/2331216519851306. Trends Hear. 2019. PMID: 31134842 Free PMC article.
References
Publication types
MeSH terms
Grants and funding
LinkOut - more resources
Full Text Sources
Medical

