Binaural unmasking with multiple adjacent masking electrodes in bilateral cochlear implant users
- PMID: 21682415
- PMCID: PMC3135149
- DOI: 10.1121/1.3570948
Binaural unmasking with multiple adjacent masking electrodes in bilateral cochlear implant users
Abstract
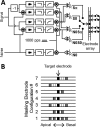
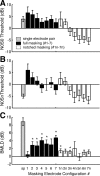
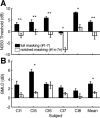
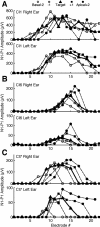
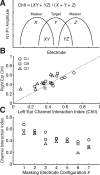
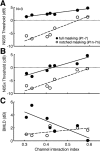
Bilateral cochlear implant (BiCI) users gain an advantage in noisy situations from a second implant, but their bilateral performance falls short of normal hearing listeners. Channel interactions due to overlapping electrical fields between electrodes can impair speech perception, but its role in limiting binaural hearing performance has not been well characterized. To address the issue, binaural masking level differences (BMLD) for a 125 Hz tone in narrowband noise were measured using a pair of pitch-matched electrodes while simultaneously presenting the same masking noise to adjacent electrodes, representing a more realistic stimulation condition compared to prior studies that used only a single electrode pair. For five subjects, BMLDs averaged 8.9 ± 1.0 dB (mean ± s.e.) in single electrode pairs but dropped to 2.1 ± 0.4 dB when presenting noise on adjacent masking electrodes, demonstrating a negative impact of the additional maskers. Removing the masking noise from only the pitch-matched electrode pair not only lowered thresholds but also resulted in smaller BMLDs. The degree of channel interaction estimated from auditory nerve evoked potentials in three subjects was significantly and negatively correlated with BMLD. The data suggest that if the amount of channel interactions can be reduced, BiCI users may experience some performance improvements related to binaural hearing.
© 2011 Acoustical Society of America
Figures


Similar articles
-
Binaural cue sensitivity in cochlear implant recipients with acoustic hearing preservation.Hear Res. 2020 May;390:107929. doi: 10.1016/j.heares.2020.107929. Epub 2020 Feb 26. Hear Res. 2020. PMID: 32182551 Free PMC article.
-
Spatial tuning curves from apical, middle, and basal electrodes in cochlear implant users.J Acoust Soc Am. 2011 Jun;129(6):3916-33. doi: 10.1121/1.3583503. J Acoust Soc Am. 2011. PMID: 21682414 Free PMC article.
-
Consonant recognition as a function of the number of stimulation channels in the Hybrid short-electrode cochlear implant.J Acoust Soc Am. 2012 Nov;132(5):3406-17. doi: 10.1121/1.4757735. J Acoust Soc Am. 2012. PMID: 23145621 Free PMC article.
-
Perception and coding of interaural time differences with bilateral cochlear implants.Hear Res. 2015 Apr;322:138-50. doi: 10.1016/j.heares.2014.10.004. Epub 2014 Oct 19. Hear Res. 2015. PMID: 25456088 Review.
-
Binaural hearing with electrical stimulation.Hear Res. 2015 Apr;322:127-37. doi: 10.1016/j.heares.2014.08.005. Epub 2014 Sep 2. Hear Res. 2015. PMID: 25193553 Free PMC article. Review.
Cited by
-
Sensitivity to interaural envelope correlation changes in bilateral cochlear-implant users.J Acoust Soc Am. 2015 Jan;137(1):335-49. doi: 10.1121/1.4904491. J Acoust Soc Am. 2015. PMID: 25618064 Free PMC article.
-
Binaural unmasking with temporal envelope and fine structure in listeners with cochlear implants.J Acoust Soc Am. 2019 May;145(5):2982. doi: 10.1121/1.5102158. J Acoust Soc Am. 2019. PMID: 31153315 Free PMC article.
-
Transitioning from bimodal to bilateral cochlear implant listening: speech recognition and localization in four individuals.Am J Audiol. 2014 Mar;23(1):79-92. doi: 10.1044/1059-0889(2013/11-0031). Am J Audiol. 2014. PMID: 24018578 Free PMC article.
-
Interaural Pitch-Discrimination Range Effects for Bilateral and Single-Sided-Deafness Cochlear-Implant Users.J Assoc Res Otolaryngol. 2019 Apr;20(2):187-203. doi: 10.1007/s10162-018-00707-x. Epub 2019 Jan 8. J Assoc Res Otolaryngol. 2019. PMID: 30623318 Free PMC article.
-
Binaural release from masking with single- and multi-electrode stimulation in children with cochlear implants.J Acoust Soc Am. 2016 Jul;140(1):59. doi: 10.1121/1.4954717. J Acoust Soc Am. 2016. PMID: 27475132 Free PMC article.
References
-
- Buss, E., Pillsbury, H. C., Buchman, C. A., Pillsbury, C. H., Clark, M. S., Haynes, D. S., Labadie, R. F., Amberg, S., Roland, P. S., Kruger, P., Novak, M. A., Wirth, J. A., Black, J. M., Peters, R., Lake, J., Wackym, P. A., Firszt, J. B., Wilson, B. S., Lawson, D. T., Schatzer, R., D’Haese, P. S., and Barco, A. L. (2008). “Multicenter U.S. bilateral MED-EL cochlear implantation study: Speech perception over the first year of use,” Ear Hear. 29, 20–32. - PubMed
Publication types
MeSH terms
Grants and funding
LinkOut - more resources
Full Text Sources
Medical
Miscellaneous

