Predicted effects of sensorineural hearing loss on across-fiber envelope coding in the auditory nerve
- PMID: 21682421
- PMCID: PMC3135152
- DOI: 10.1121/1.3583502
Predicted effects of sensorineural hearing loss on across-fiber envelope coding in the auditory nerve
Abstract
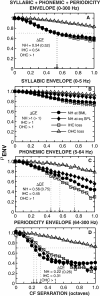
Cross-channel envelope correlations are hypothesized to influence speech intelligibility, particularly in adverse conditions. Acoustic analyses suggest speech envelope correlations differ for syllabic and phonemic ranges of modulation frequency. The influence of cochlear filtering was examined here by predicting cross-channel envelope correlations in different speech modulation ranges for normal and impaired auditory-nerve (AN) responses. Neural cross-correlation coefficients quantified across-fiber envelope coding in syllabic (0-5 Hz), phonemic (5-64 Hz), and periodicity (64-300 Hz) modulation ranges. Spike trains were generated from a physiologically based AN model. Correlations were also computed using the model with selective hair-cell damage. Neural predictions revealed that envelope cross-correlation decreased with increased characteristic-frequency separation for all modulation ranges (with greater syllabic-envelope correlation than phonemic or periodicity). Syllabic envelope was highly correlated across many spectral channels, whereas phonemic and periodicity envelopes were correlated mainly between adjacent channels. Outer-hair-cell impairment increased the degree of cross-channel correlation for phonemic and periodicity ranges for speech in quiet and in noise, thereby reducing the number of independent neural information channels for envelope coding. In contrast, outer-hair-cell impairment was predicted to decrease cross-channel correlation for syllabic envelopes in noise, which may partially account for the reduced ability of hearing-impaired listeners to segregate speech in complex backgrounds.
© 2011 Acoustical Society of America
Figures


Similar articles
-
Quantifying envelope and fine-structure coding in auditory nerve responses to chimaeric speech.J Assoc Res Otolaryngol. 2009 Sep;10(3):407-23. doi: 10.1007/s10162-009-0169-8. Epub 2009 Apr 14. J Assoc Res Otolaryngol. 2009. PMID: 19365691 Free PMC article.
-
Synaptopathy in the noise-exposed and aging cochlea: Primary neural degeneration in acquired sensorineural hearing loss.Hear Res. 2015 Dec;330(Pt B):191-9. doi: 10.1016/j.heares.2015.02.009. Epub 2015 Mar 11. Hear Res. 2015. PMID: 25769437 Free PMC article.
-
Magnified Neural Envelope Coding Predicts Deficits in Speech Perception in Noise.J Neurosci. 2017 Aug 9;37(32):7727-7736. doi: 10.1523/JNEUROSCI.2722-16.2017. Epub 2017 Jul 10. J Neurosci. 2017. PMID: 28694336 Free PMC article.
-
Effects of sensorineural hearing loss on temporal coding of narrowband and broadband signals in the auditory periphery.Hear Res. 2013 Sep;303:39-47. doi: 10.1016/j.heares.2013.01.014. Epub 2013 Jan 29. Hear Res. 2013. PMID: 23376018 Free PMC article. Review.
-
Audibility, speech perception and processing of temporal cues in ribbon synaptic disorders due to OTOF mutations.Hear Res. 2015 Dec;330(Pt B):200-12. doi: 10.1016/j.heares.2015.07.007. Epub 2015 Jul 15. Hear Res. 2015. PMID: 26188103 Review.
Cited by
-
Speech Categorization Reveals the Role of Early-Stage Temporal-Coherence Processing in Auditory Scene Analysis.J Neurosci. 2022 Jan 12;42(2):240-254. doi: 10.1523/JNEUROSCI.1610-21.2021. Epub 2021 Nov 11. J Neurosci. 2022. PMID: 34764159 Free PMC article.
-
Dual Coding of Frequency Modulation in the Ventral Cochlear Nucleus.J Neurosci. 2018 Apr 25;38(17):4123-4137. doi: 10.1523/JNEUROSCI.2107-17.2018. Epub 2018 Mar 29. J Neurosci. 2018. PMID: 29599389 Free PMC article.
-
Psychophysiological analyses demonstrate the importance of neural envelope coding for speech perception in noise.J Neurosci. 2012 Feb 1;32(5):1747-56. doi: 10.1523/JNEUROSCI.4493-11.2012. J Neurosci. 2012. PMID: 22302814 Free PMC article.
-
Impact of reduced spectral resolution on temporal-coherence-based source segregation.J Acoust Soc Am. 2024 Dec 1;156(6):3862-3876. doi: 10.1121/10.0034545. J Acoust Soc Am. 2024. PMID: 39655945
-
Speech perception in noise with a harmonic complex excited vocoder.J Assoc Res Otolaryngol. 2014 Apr;15(2):265-78. doi: 10.1007/s10162-013-0435-7. Epub 2014 Jan 22. J Assoc Res Otolaryngol. 2014. PMID: 24448721 Free PMC article.
References
-
- Arai, T., and Greenberg, S. (1997). “The temporal properties of spoken Japanese are similar to those of English,” in Proceedings of EUROSPEECH, Rhodes, Greece, pp. 1011–1014.
Publication types
MeSH terms
Grants and funding
LinkOut - more resources
Full Text Sources

