

Phylogeography and demographic history of Lacerta lepida in the Iberian Peninsula: multiple refugia, range expansions and secondary contact zones
- PMID: 21682856
- PMCID: PMC3141430
- DOI: 10.1186/1471-2148-11-170
Phylogeography and demographic history of Lacerta lepida in the Iberian Peninsula: multiple refugia, range expansions and secondary contact zones
Abstract
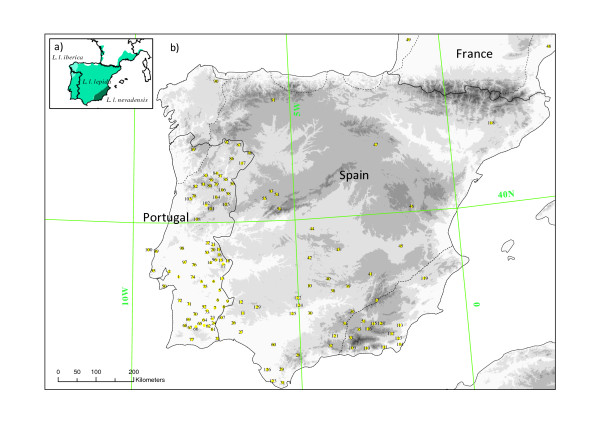
Background: The Iberian Peninsula is recognized as an important refugial area for species survival and diversification during the climatic cycles of the Quaternary. Recent phylogeographic studies have revealed Iberia as a complex of multiple refugia. However, most of these studies have focused either on species with narrow distributions within the region or species groups that, although widely distributed, generally have a genetic structure that relates to pre-Quaternary cladogenetic events. In this study we undertake a detailed phylogeographic analysis of the lizard species, Lacerta lepida, whose distribution encompasses the entire Iberian Peninsula. We attempt to identify refugial areas, recolonization routes, zones of secondary contact and date demographic events within this species.
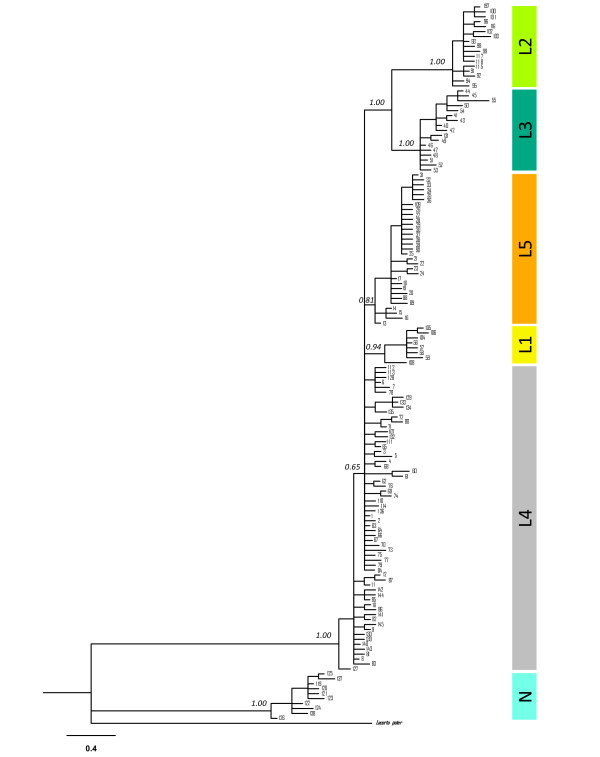
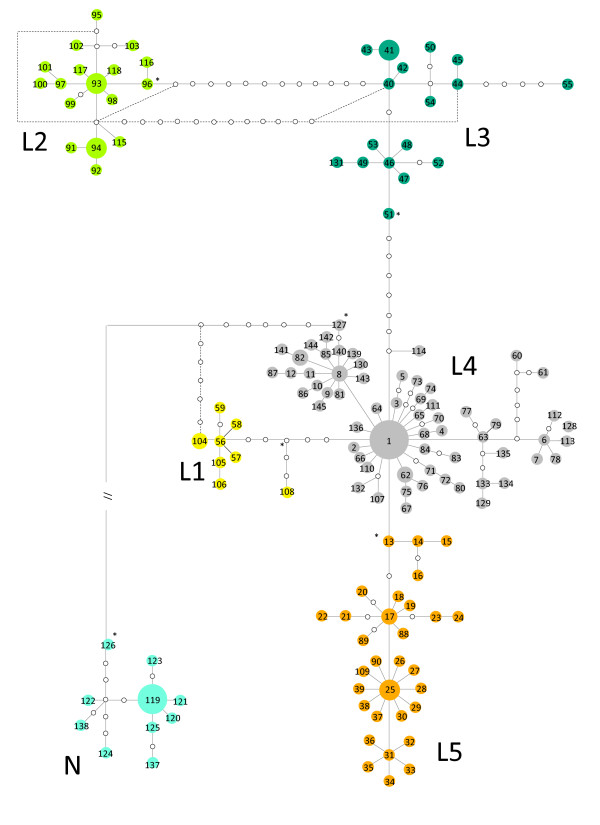
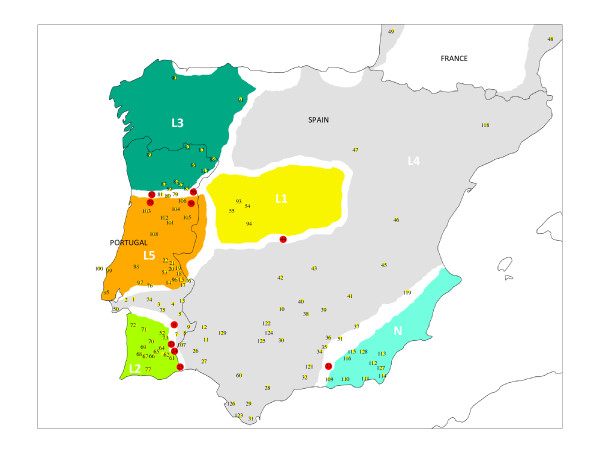
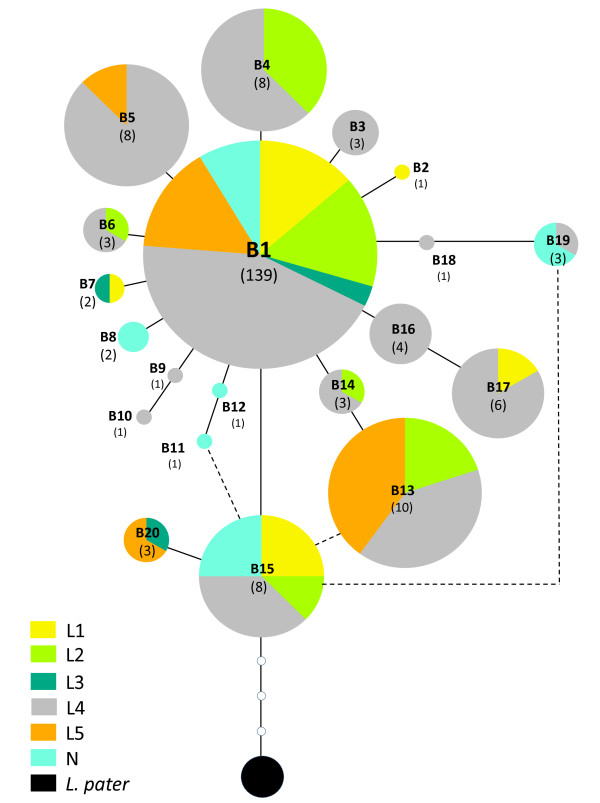
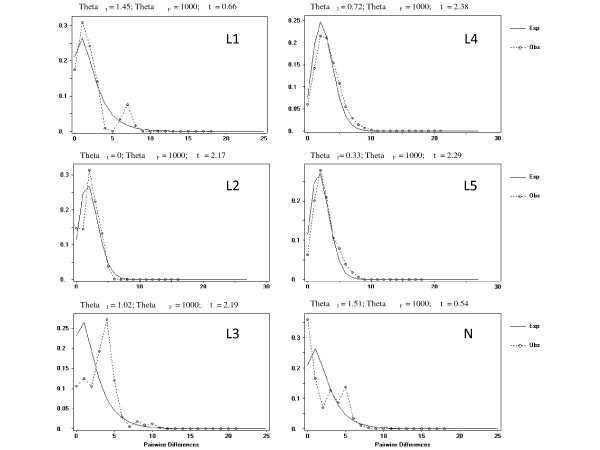
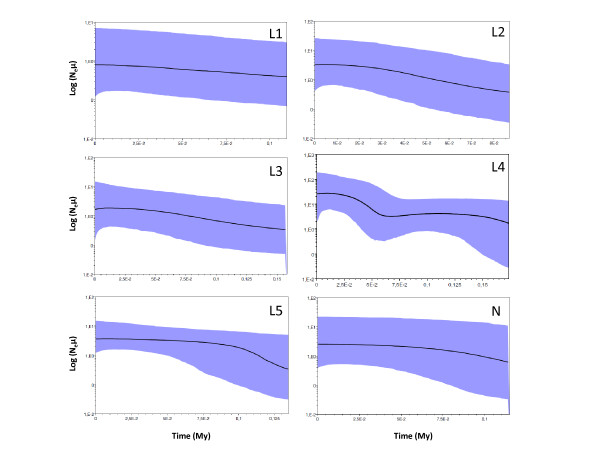
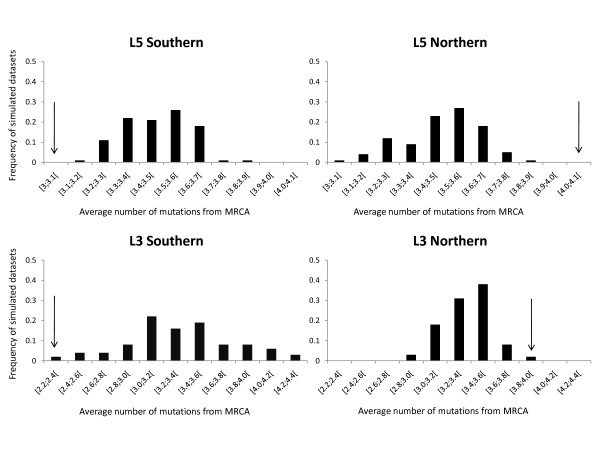
Results: Results support the existence of 6 evolutionary lineages (phylogroups) with a strong association between genetic variation and geography, suggesting a history of allopatric divergence in different refugia. Diversification within phylogroups is concordant with the onset of the Pleistocene climatic oscillations. The southern regions of several phylogroups show a high incidence of ancestral alleles in contrast with high incidence of recently derived alleles in northern regions. All phylogroups show signs of recent demographic and spatial expansions. We have further identified several zones of secondary contact, with divergent mitochondrial haplotypes occurring in narrow zones of sympatry.
Conclusions: The concordant patterns of spatial and demographic expansions detected within phylogroups, together with the high incidence of ancestral haplotypes in southern regions of several phylogroups, suggests a pattern of contraction of populations into southern refugia during adverse climatic conditions from which subsequent northern expansions occurred. This study supports the emergent pattern of multiple refugia within Iberia but adds to it by identifying a pattern of refugia coincident with the southern distribution limits of individual evolutionary lineages. These areas are important in terms of long-term species persistence and therefore important areas for conservation.
Figures
Similar articles
-
Persistence across Pleistocene ice ages in Mediterranean and extra-Mediterranean refugia: phylogeographic insights from the common wall lizard.BMC Evol Biol. 2013 Jul 11;13:147. doi: 10.1186/1471-2148-13-147. BMC Evol Biol. 2013. PMID: 23841475 Free PMC article.
-
Geography and past climate changes have shaped the evolution of a widespread lizard from the Chilean hotspot.Mol Phylogenet Evol. 2017 Nov;116:157-171. doi: 10.1016/j.ympev.2017.08.016. Epub 2017 Sep 5. Mol Phylogenet Evol. 2017. PMID: 28887150
-
Phylogeography and historical demography of the Lusitanian snail Elona quimperiana reveal survival in unexpected separate glacial refugia.BMC Evol Biol. 2008 Dec 19;8:339. doi: 10.1186/1471-2148-8-339. BMC Evol Biol. 2008. PMID: 19099565 Free PMC article.
-
Impacts of Quaternary glaciation, geological history and geography on animal species history in continental East Asia: A phylogeographic review.Mol Ecol. 2023 Aug;32(16):4497-4514. doi: 10.1111/mec.17053. Epub 2023 Jun 18. Mol Ecol. 2023. PMID: 37332105 Review.
-
Common patterns in the molecular phylogeography of western palearctic birds: a comprehensive review.J Ornithol. 2021;162(4):937-959. doi: 10.1007/s10336-021-01893-x. Epub 2021 May 13. J Ornithol. 2021. PMID: 34007780 Free PMC article. Review.
Cited by
-
Challenges and pitfalls in the characterization of anonymous outlier AFLP markers in non-model species: lessons from an ocellated lizard genome scan.Heredity (Edinb). 2012 Dec;109(6):340-8. doi: 10.1038/hdy.2012.48. Epub 2012 Aug 15. Heredity (Edinb). 2012. PMID: 22892639 Free PMC article.
-
Iberian red deer: paraphyletic nature at mtDNA but nuclear markers support its genetic identity.Ecol Evol. 2016 Jan 28;6(4):905-22. doi: 10.1002/ece3.1836. eCollection 2016 Feb. Ecol Evol. 2016. PMID: 26843924 Free PMC article.
-
PSMC analysis of effective population sizes in molecular ecology and its application to black-and-white Ficedula flycatchers.Mol Ecol. 2016 Mar;25(5):1058-72. doi: 10.1111/mec.13540. Epub 2016 Feb 15. Mol Ecol. 2016. PMID: 26797914 Free PMC article.
-
Subterranean termite phylogeography reveals multiple postglacial colonization events in southwestern Europe.Ecol Evol. 2016 Jul 27;6(16):5987-6004. doi: 10.1002/ece3.2333. eCollection 2016 Aug. Ecol Evol. 2016. PMID: 27547371 Free PMC article.
-
Phylogeography of the Asian lesser white-toothed shrew, Crocidura shantungensis, in East Asia: role of the Korean Peninsula as refugium for small mammals.Genetica. 2018 Apr;146(2):211-226. doi: 10.1007/s10709-018-0014-2. Epub 2018 Feb 13. Genetica. 2018. PMID: 29441472
References
-
- Hewitt GM. Some genetic consequences of ice ages, and their role, in divergence and speciation. Biological Journal of the Linnean Society. 1996;58:247–276.
-
- Hewitt GM. In: Hybrid zones and the evolutionary process. Harrison RG, editor. New York: Oxford University Press; 1993. After the Ice: Parallelus meets Erythropus in the Pyrenees.
-
- Gomez A, Lunt DH. In: Phylogeography of Southern European Refugia. Weiss S, Ferrand N, editor. Dordrecht: Springer; 2007. Refugia within refugia: patterns of phylogeographic concordance in the Iberian Peninsula.
Publication types
MeSH terms
LinkOut - more resources
Full Text Sources
