

Best practice for motor imagery: a systematic literature review on motor imagery training elements in five different disciplines
- PMID: 21682867
- PMCID: PMC3141540
- DOI: 10.1186/1741-7015-9-75
Best practice for motor imagery: a systematic literature review on motor imagery training elements in five different disciplines
Abstract
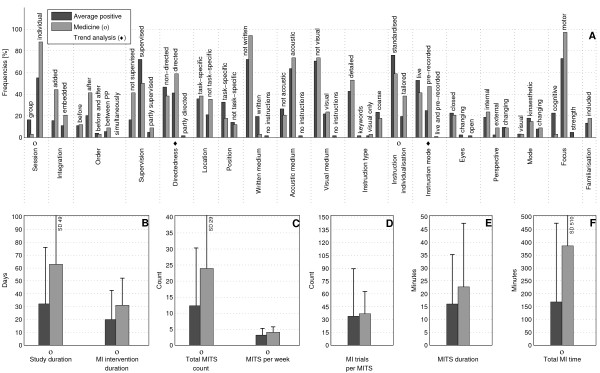
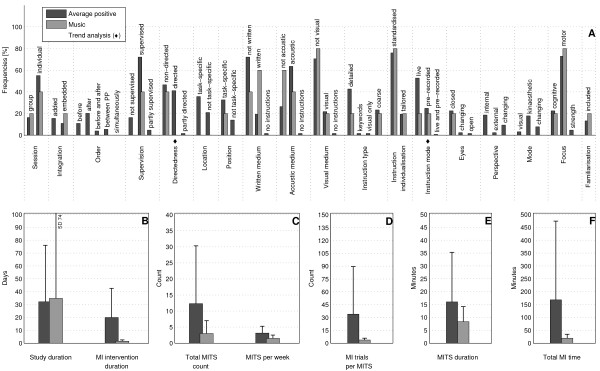
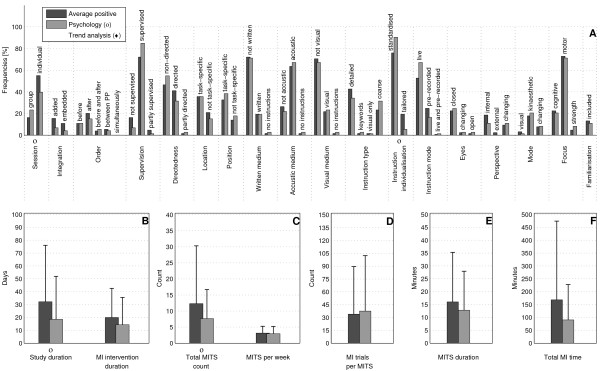
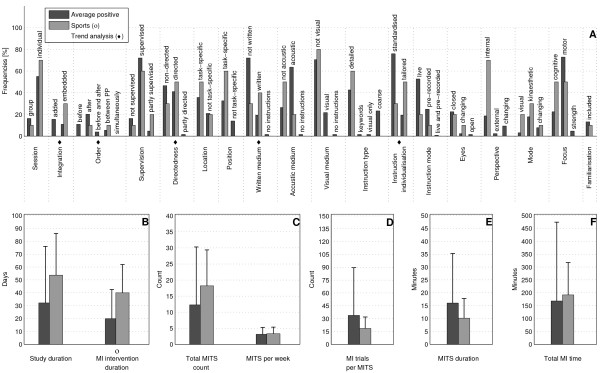
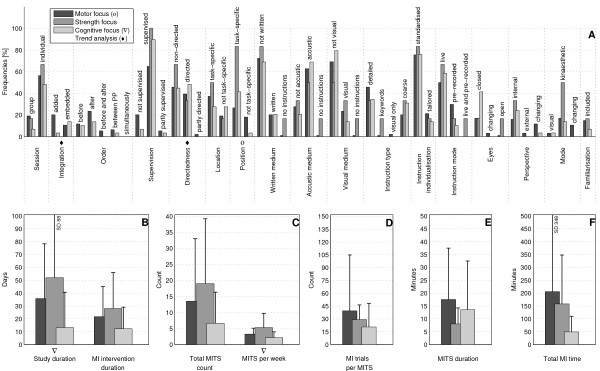
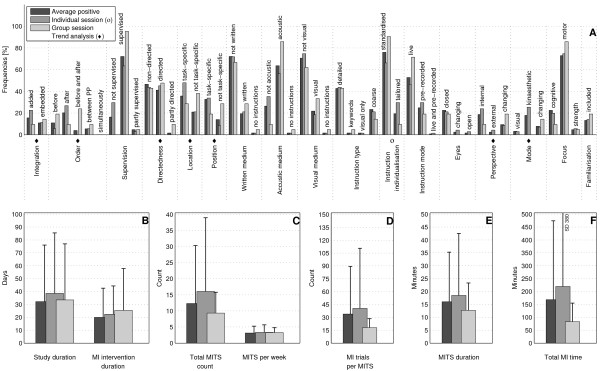
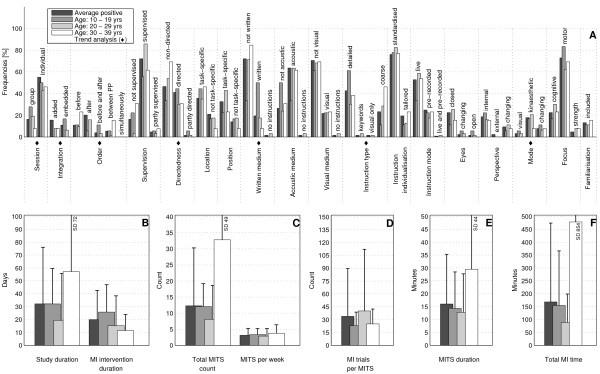
Background: The literature suggests a beneficial effect of motor imagery (MI) if combined with physical practice, but detailed descriptions of MI training session (MITS) elements and temporal parameters are lacking. The aim of this review was to identify the characteristics of a successful MITS and compare these for different disciplines, MI session types, task focus, age, gender and MI modification during intervention.
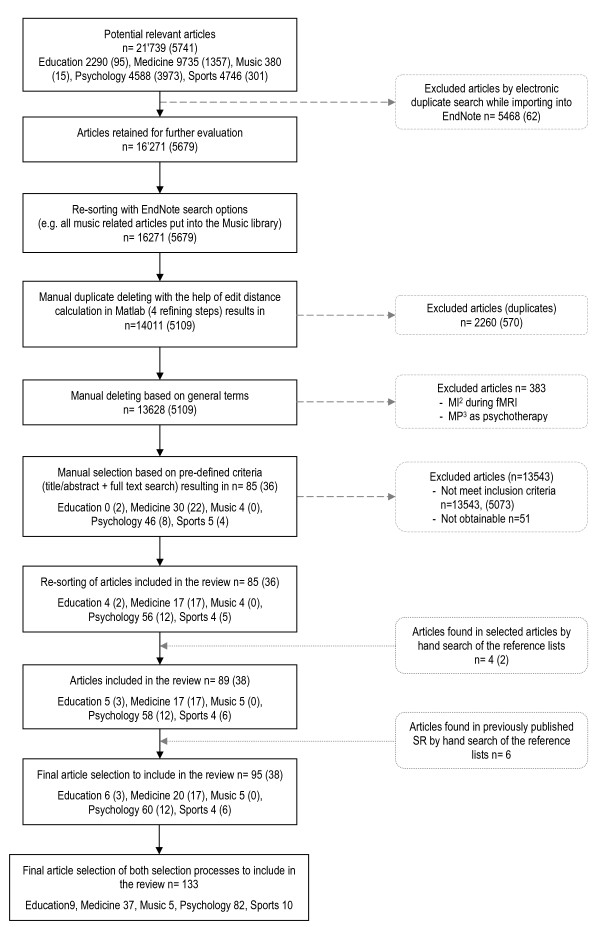
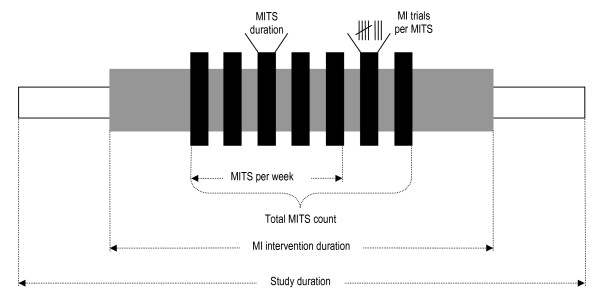
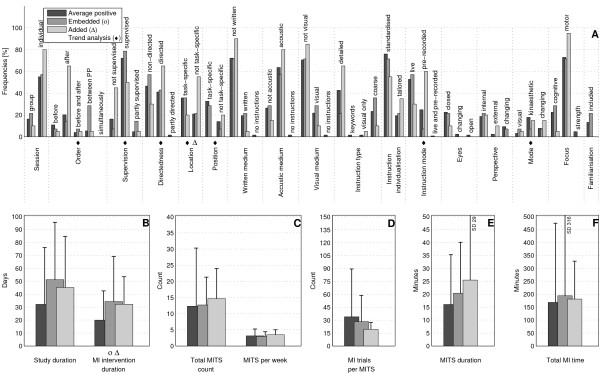
Methods: An extended systematic literature search using 24 databases was performed for five disciplines: Education, Medicine, Music, Psychology and Sports. References that described an MI intervention that focused on motor skills, performance or strength improvement were included. Information describing 17 MITS elements was extracted based on the PETTLEP (physical, environment, timing, task, learning, emotion, perspective) approach. Seven elements describing the MITS temporal parameters were calculated: study duration, intervention duration, MITS duration, total MITS count, MITS per week, MI trials per MITS and total MI training time.
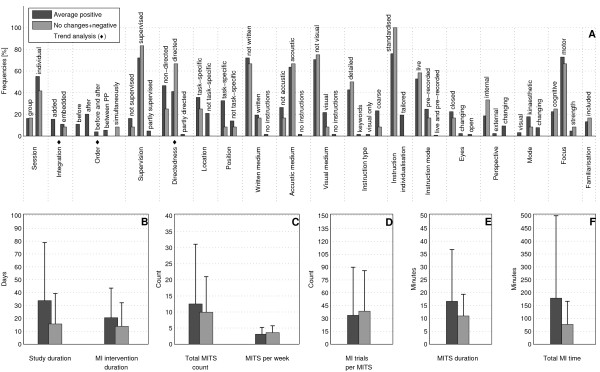
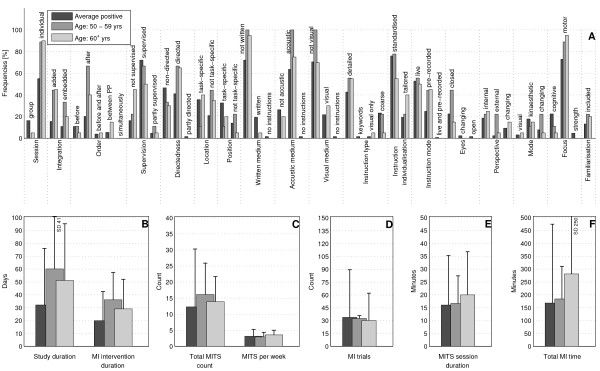
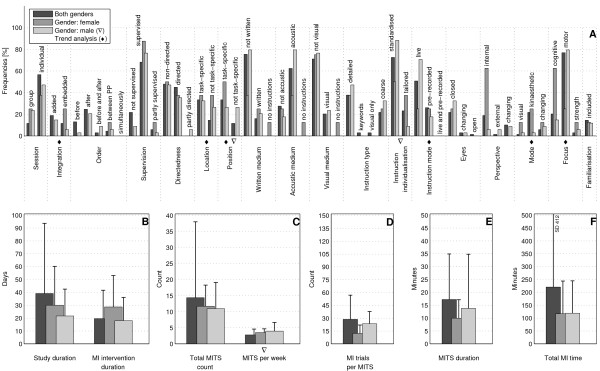
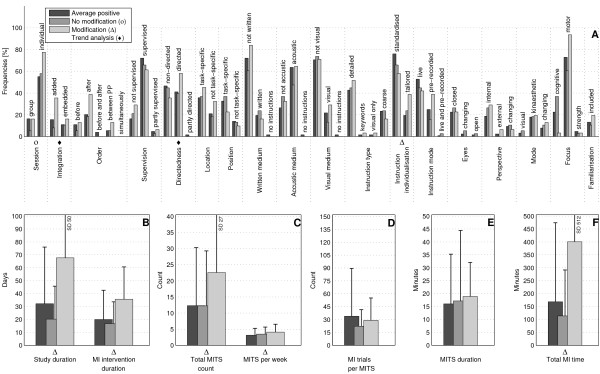
Results: Both independent reviewers found 96% congruity, which was tested on a random sample of 20% of all references. After selection, 133 studies reporting 141 MI interventions were included. The locations of the MITS and position of the participants during MI were task-specific. Participants received acoustic detailed MI instructions, which were mostly standardised and live. During MI practice, participants kept their eyes closed. MI training was performed from an internal perspective with a kinaesthetic mode. Changes in MI content, duration and dosage were reported in 31 MI interventions. Familiarisation sessions before the start of the MI intervention were mentioned in 17 reports. MI interventions focused with decreasing relevance on motor-, cognitive- and strength-focused tasks. Average study intervention lasted 34 days, with participants practicing MI on average three times per week for 17 minutes, with 34 MI trials. Average total MI time was 178 minutes including 13 MITS. Reporting rate varied between 25.5% and 95.5%.
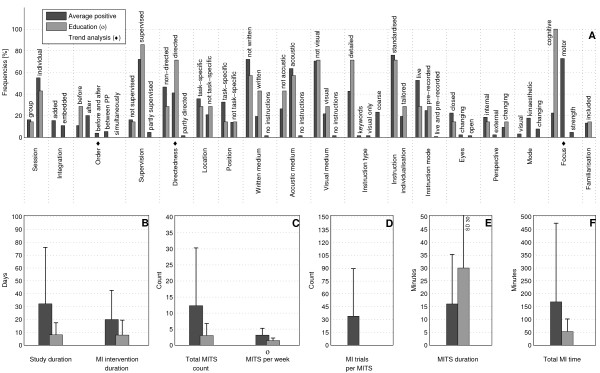
Conclusions: MITS elements of successful interventions were individual, supervised and non-directed sessions, added after physical practice. Successful design characteristics were dominant in the Psychology literature, in interventions focusing on motor and strength-related tasks, in interventions with participants aged 20 to 29 years old, and in MI interventions including participants of both genders. Systematic searching of the MI literature was constrained by the lack of a defined MeSH term.
Figures
Similar articles
-
Physical exercise training interventions for children and young adults during and after treatment for childhood cancer.Cochrane Database Syst Rev. 2016 Mar 31;3(3):CD008796. doi: 10.1002/14651858.CD008796.pub3. Cochrane Database Syst Rev. 2016. PMID: 27030386 Free PMC article.
-
Health professionals' experience of teamwork education in acute hospital settings: a systematic review of qualitative literature.JBI Database System Rev Implement Rep. 2016 Apr;14(4):96-137. doi: 10.11124/JBISRIR-2016-1843. JBI Database System Rev Implement Rep. 2016. PMID: 27532314
-
Education support services for improving school engagement and academic performance of children and adolescents with a chronic health condition.Cochrane Database Syst Rev. 2023 Feb 8;2(2):CD011538. doi: 10.1002/14651858.CD011538.pub2. Cochrane Database Syst Rev. 2023. PMID: 36752365 Free PMC article.
-
Patient education in the management of coronary heart disease.Cochrane Database Syst Rev. 2017 Jun 28;6(6):CD008895. doi: 10.1002/14651858.CD008895.pub3. Cochrane Database Syst Rev. 2017. PMID: 28658719 Free PMC article.
-
Effects and Dose-Response Relationships of Motor Imagery Practice on Strength Development in Healthy Adult Populations: a Systematic Review and Meta-analysis.Sports Med. 2018 May;48(5):1165-1187. doi: 10.1007/s40279-018-0874-8. Sports Med. 2018. PMID: 29541965
Cited by
-
Adapting Motor Imagery Training Protocols to Surgical Education: A Systematic Review and Meta-Analysis.Surg Innov. 2021 Jun;28(3):329-351. doi: 10.1177/1553350621990480. Epub 2021 Mar 12. Surg Innov. 2021. PMID: 33710912 Free PMC article.
-
High-density surface electromyography maps after computer-aided training in individual with congenital transverse deficiency: a case study.BMC Musculoskelet Disord. 2020 Oct 15;21(1):682. doi: 10.1186/s12891-020-03694-4. BMC Musculoskelet Disord. 2020. PMID: 33059684 Free PMC article.
-
Improvement in precision grip force control with self-modulation of primary motor cortex during motor imagery.Front Behav Neurosci. 2015 Feb 13;9:18. doi: 10.3389/fnbeh.2015.00018. eCollection 2015. Front Behav Neurosci. 2015. PMID: 25762907 Free PMC article.
-
Hemodynamic Signal Changes During Motor Imagery Task Performance Are Associated With the Degree of Motor Task Learning.Front Hum Neurosci. 2021 Apr 15;15:603069. doi: 10.3389/fnhum.2021.603069. eCollection 2021. Front Hum Neurosci. 2021. PMID: 33935666 Free PMC article.
-
Acquisition of Procedural Skills in Preregistration Physiotherapy Education Comparing Mental Practice Against No Mental Practice: The Learning of Procedures in Physiotherapy Education Trial - A Development of Concept Study.J Med Educ Curric Dev. 2020 Sep 10;7:2382120520927382. doi: 10.1177/2382120520927382. eCollection 2020 Jan-Dec. J Med Educ Curric Dev. 2020. PMID: 32964124 Free PMC article.
References
-
- Feltz DL, Landers DM. The effects of mental practice on motor skill learning and performance: a meta-analysis. J Sport Exerc Psych. 1983;5:25–57.
-
- Feltz D, Landers DM, Becker BJ. In: Enhancing Human Performance: Issues, theories, and techniques. Druckmann D, Swets JA, editor. Washington D.C. National Academy Press; 1988. A revised meta-analysis of the mental practice literature on motor skill learning; pp. 61–101.
-
- Fell NT. Mental rehearsal as a complementary treatment in geriatric rehabilitation. Phys Occup Ther Geriatr. 2001;18(4):51–63.
-
- Batson G. Motor imagery for stroke rehabilitation: current research as a guide to clinical practice. Alternative & Complementary Therapies. 2004;10(2):84–89. doi: 10.1089/107628004773933325. - DOI
Publication types
MeSH terms
LinkOut - more resources
Full Text Sources
Medical
