

Enhancements to the ADMIXTURE algorithm for individual ancestry estimation
- PMID: 21682921
- PMCID: PMC3146885
- DOI: 10.1186/1471-2105-12-246
Enhancements to the ADMIXTURE algorithm for individual ancestry estimation
Abstract
Background: The estimation of individual ancestry from genetic data has become essential to applied population genetics and genetic epidemiology. Software programs for calculating ancestry estimates have become essential tools in the geneticist's analytic arsenal.
Results: Here we describe four enhancements to ADMIXTURE, a high-performance tool for estimating individual ancestries and population allele frequencies from SNP (single nucleotide polymorphism) data. First, ADMIXTURE can be used to estimate the number of underlying populations through cross-validation. Second, individuals of known ancestry can be exploited in supervised learning to yield more precise ancestry estimates. Third, by penalizing small admixture coefficients for each individual, one can encourage model parsimony, often yielding more interpretable results for small datasets or datasets with large numbers of ancestral populations. Finally, by exploiting multiple processors, large datasets can be analyzed even more rapidly.
Conclusions: The enhancements we have described make ADMIXTURE a more accurate, efficient, and versatile tool for ancestry estimation.
Figures
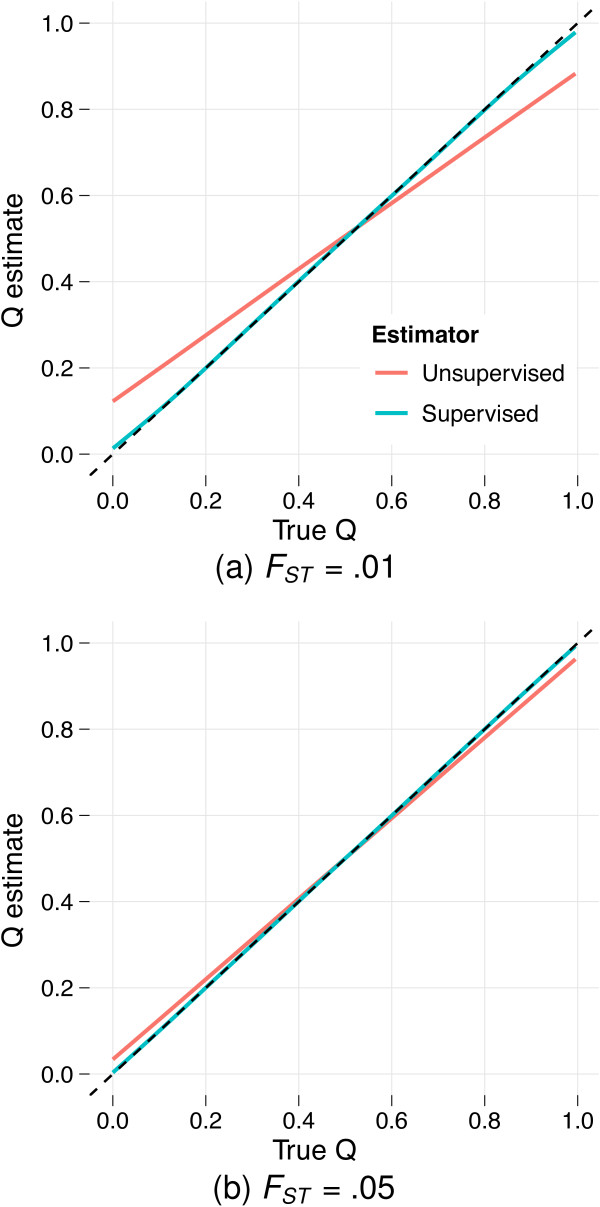
 between the true ancestry fraction qi1 (fraction of ancestry attributed to population 1) and the resulting estimate
  as determined via a nonparametric regression (LOESS) model fitted to the results from analyses of 100 simulated datasets. Reference individuals are excluded from the plots and regression analyses. The dotted line y = x is tracked closely by the conditional mean of supervised estimates, suggesting little bias. However, in panel (a) (simulations with FST = .01) the conditional mean of the unsupervised estimates deviates substantially, exhibiting an upward bias for low qi1 and a downward bias for high qi1. The bias is mitigated using simulations with FST = .05, as shown in panel (b), or by using a larger number of markers (J = 300, 000, not shown).
References
Publication types
MeSH terms
Grants and funding
LinkOut - more resources
Full Text Sources
Other Literature Sources
Molecular Biology Databases
