In vivo imaging of rat coronary arteries using bi-plane digital subtraction angiography
- PMID: 21683146
- PMCID: PMC3200458
- DOI: 10.1016/j.vascn.2011.05.008
In vivo imaging of rat coronary arteries using bi-plane digital subtraction angiography
Abstract
Introduction: X-ray based digital subtraction angiography (DSA) is a common clinical imaging method for vascular morphology and function. Coronary artery characterization is one of its most important applications. We show that bi-plane DSA of rat coronary arteries can provide a powerful imaging tool for translational safety assessment in drug discovery.
Methods: A novel, dual tube/detector system, constructed explicitly for preclinical imaging, supports image acquisition at 10 frames/s with 88-micron spatial resolution. Ventilation, x-ray exposure, and contrast injection are all precisely synchronized using a biological sequence controller implemented as a LabVIEW application. A set of experiments were performed to test and optimize the sampling and image quality. We applied the DSA imaging protocol to record changes in the visualization of coronaries and myocardial perfusion induced by a vasodilator drug, nitroprusside. The drug was infused into a tail vein catheter using a peristaltic infusion pump at a rate of 0.07 mL/h for 3 min (dose: 0.0875 mg). Multiple DSA sequences were acquired before, during, and up to 25 min after drug infusion. Perfusion maps of the heart were generated in MATLAB to compare the drug effects over time.
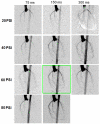
Results: The best trade-off between the injection time, pressure, and image quality was achieved at 60 PSI, with the injection of 150 ms occurring early in diastole (60 ms delay) and resulting in the delivery of 113 μL of contrast agent. DSA images clearly show the main branches of the coronary arteries in an intact, beating heart. The drug test demonstrated that DSA can detect relative changes in coronary circulation via perfusion maps.
Conclusions: The methodology for DSA imaging of rat coronary arteries can serve as a template for future translational studies to assist in safety evaluation of new pharmaceuticals. Although x-ray imaging involves radiation, the associated dose (0.4 Gy) is not a major limitation.
Copyright © 2011 Elsevier Inc. All rights reserved.
Figures


Similar articles
-
Improved visualization of the coronary arteries using motion correction during vasodilator stress CT myocardial perfusion imaging.Eur J Radiol. 2019 May;114:1-5. doi: 10.1016/j.ejrad.2019.02.010. Epub 2019 Mar 2. Eur J Radiol. 2019. PMID: 31005158 Free PMC article.
-
[New developments in parameter-oriented roentgen densitometry perfusion analysis within the scope of heart catheter studies].Herz. 1997 Apr;22(2):72-86. doi: 10.1007/BF03044306. Herz. 1997. PMID: 9206707 Review. German.
-
Development of digital subtraction angiography for coronary artery.J Digit Imaging. 2009 Jun;22(3):319-25. doi: 10.1007/s10278-008-9108-1. Epub 2008 Mar 20. J Digit Imaging. 2009. PMID: 18351421 Free PMC article.
-
Digital subtraction rotational angiography for aneurysms of the intracranial anterior circulation: injection method and optimization.AJNR Am J Neuroradiol. 1996 Jun-Jul;17(6):1127-36. AJNR Am J Neuroradiol. 1996. PMID: 8791927 Free PMC article.
-
Arterial imaging in patients with lower extremity ischemia and diabetes mellitus.J Vasc Surg. 2010 Sep;52(3 Suppl):81S-91S. doi: 10.1016/j.jvs.2010.06.013. J Vasc Surg. 2010. PMID: 20804938 Review.
Cited by
-
Technical Note: Contrast free angiography of the pulmonary vasculature in live mice using a laboratory x-ray source.Med Phys. 2016 Nov;43(11):6017. doi: 10.1118/1.4964794. Med Phys. 2016. PMID: 27806595 Free PMC article.
-
A LabVIEW Platform for Preclinical Imaging Using Digital Subtraction Angiography and Micro-CT.J Med Eng. 2013;2013:581617. doi: 10.1155/2013/581617. Epub 2013 Feb 28. J Med Eng. 2013. PMID: 27006920 Free PMC article.
References
-
- Badea CT, Hedlund LW, et al. Tumor imaging in small animals with a combined micro-CT/micro-DSA system using iodinated conventional and blood pool contrast agents. Contrast Media Mol Imaging. 2006;1(4):153–164. - PubMed
Publication types
MeSH terms
Substances
Grants and funding
LinkOut - more resources
Full Text Sources

