. 2011 Jul 15;89(1):121-30.
doi: 10.1016/j.ajhg.2011.05.015. Epub 2011 Jun 16.

Expansion of intronic GGCCTG hexanucleotide repeat in NOP56 causes SCA36, a type of spinocerebellar ataxia accompanied by motor neuron involvement

Affiliations

Expansion of intronic GGCCTG hexanucleotide repeat in NOP56 causes SCA36, a type of spinocerebellar ataxia accompanied by motor neuron involvement

Hatasu Kobayashi et al. Am J Hum Genet. .

Abstract

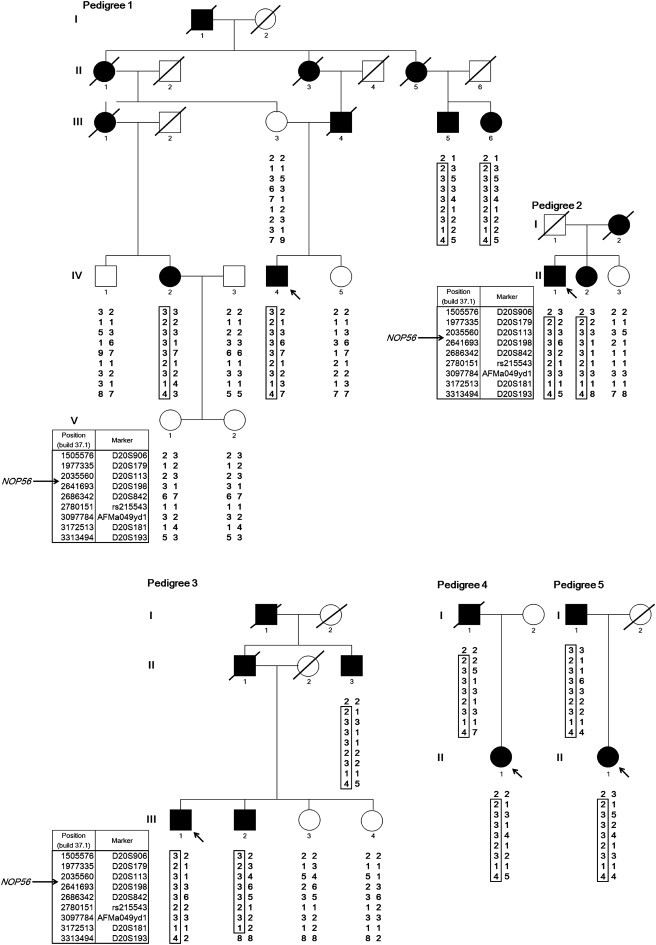
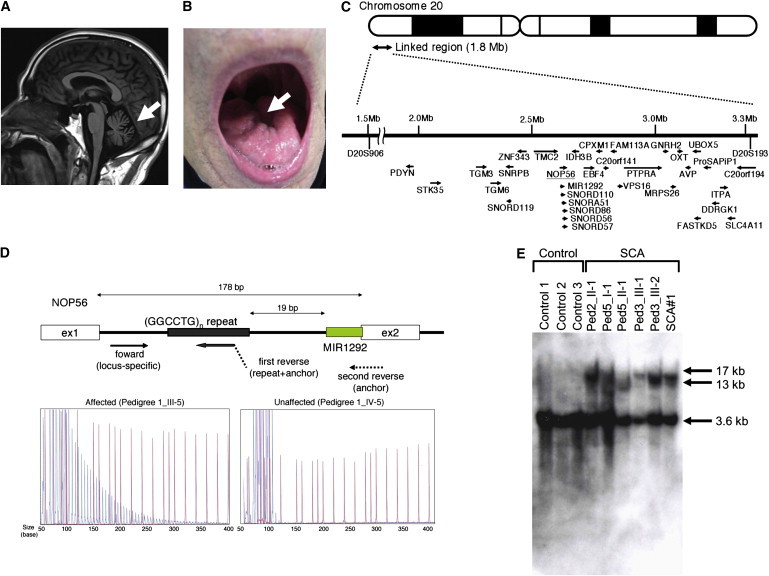
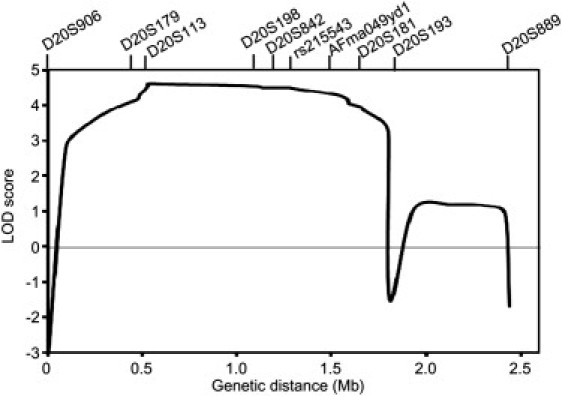
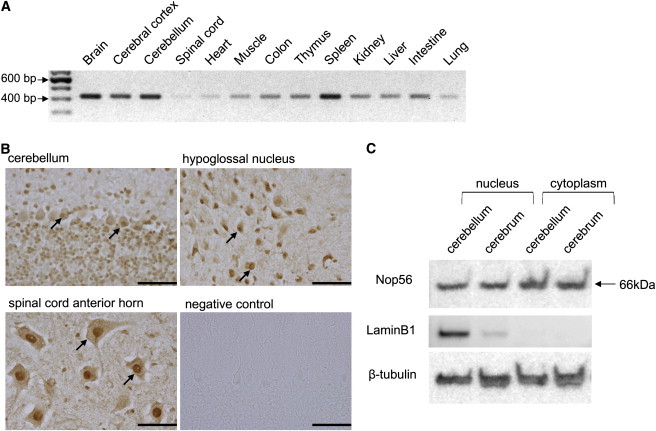
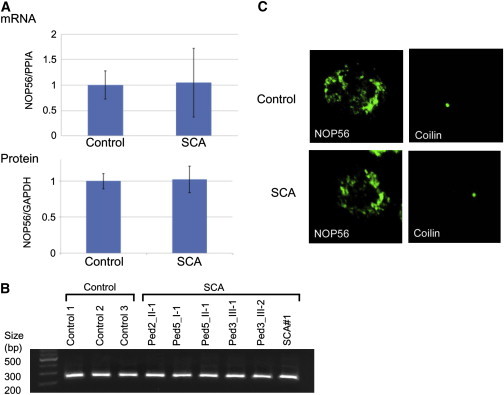
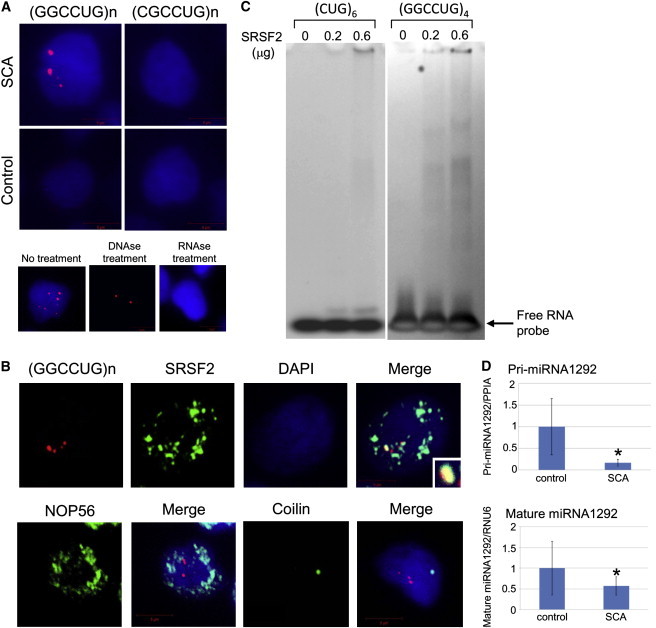
Autosomal-dominant spinocerebellar ataxias (SCAs) are a heterogeneous group of neurodegenerative disorders. In this study, we performed genetic analysis of a unique form of SCA (SCA36) that is accompanied by motor neuron involvement. Genome-wide linkage analysis and subsequent fine mapping for three unrelated Japanese families in a cohort of SCA cases, in whom molecular diagnosis had never been performed, mapped the disease locus to the region of a 1.8 Mb stretch (LOD score of 4.60) on 20p13 (D20S906-D20S193) harboring 37 genes with definitive open reading frames. We sequenced 33 of these and observed a large expansion of an intronic GGCCTG hexanucleotide repeat in NOP56 and an unregistered missense variant (Phe265Leu) in C20orf194, but we found no mutations in PDYN and TGM6. The expansion showed complete segregation with the SCA phenotype in family studies, whereas Phe265Leu in C20orf194 did not. Screening of the expansions in the SCA cohort cases revealed four additional occurrences, but none were revealed in the cohort of 27 Alzheimer disease cases, 154 amyotrophic lateral sclerosis cases, or 300 controls. In total, nine unrelated cases were found in 251 cohort SCA patients (3.6%). A founder haplotype was confirmed in these cases. RNA foci formation was detected in lymphoblastoid cells from affected subjects by fluorescence in situ hybridization. Double staining and gel-shift assay showed that (GGCCUG)n binds the RNA-binding protein SRSF2 but that (CUG)(6) does not. In addition, transcription of MIR1292, a neighboring miRNA, was significantly decreased in lymphoblastoid cells of SCA patients. Our finding suggests that SCA36 is caused by hexanucleotide repeat expansions through RNA gain of function.


Figures

Figure 1
Figure 1
Pedigree Charts of the Five SCA Families Haplotypes are shown for nine markers from D20S906 (1,505,576 bp) to D20S193 (3,313,494 bp), spanning 1.8 Mb on chromosome 20p13. NOP56 is located at 2,633,254–2,639,039 bp (NCBI build 37.1). Filled and unfilled symbols indicate affected and unaffected individuals, respectively. Squares and circles represent males and females, respectively. A slash indicates a deceased individual. The putative founder haplotypes among patients are shown in boxes constructed by GENHUNTER. Arrows indicate the index case. The pedigrees were slightly modified for privacy protection.
Figure 2
Figure 2
Motor Neuron Involvement and (GGCCTG)n Expansion in the First Intron of NOP56 (A) MRI of an affected subject (SCA#3) showed mild cerebellar atrophy (arrow) but no other cerebral or brainstem pathology. (B) Tongue atrophy (arrow) was observed in SCA#1. (C) Physical map of the 1.8-Mb linkage region from D20S906 (1,505,576 bp) to D20S193 (3,313,494 bp), with 33 candidate genes shown, as well as the direction of transcription (arrows). (D) The upper portion of the panel shows the scheme of primer binding for repeat-primer PCR analysis. In the lower portion, sequence traces of the PCR reactions are shown. Red lines indicate the size markers. The vertical axis indicates arbitrary intensity levels. A typical saw-tooth pattern is observed in an affected pedigree. (E) Southern blotting of LCLs from SCA cases and three controls. Genomic DNA (10 μg) was extracted from Epstein-Barr virus (EBV)-immortalized LCLs derived from six affected subjects (Ped2_II-1, Ped3_III-1, Ped3_III-2, Ped5_I-1, Ped5_II-1, and SCA#1) and digested with 2 U of AvrII overnight (New England Biolabs, Beverly, MA, USA). A probe covering exon 4 of NOP56 (452 bp) was subjected to PCR amplification from human genomic DNA with the use of primers (Table S3) and labeled with 32P-dCTP.
Figure 3
Figure 3
Multipoint Linkage Analysis with Ten Markers on Chromosome 20p13
Figure 4
Figure 4
Nop56 in the Mouse Nervous System (A) RT-PCR analysis of Nop56 (422 bp) in various mouse tissues. cDNA (25 ng) collected from various organs of C57BL/6 mice was purchased from GenoStaf (Tokyo, Japan). (B) Immunohistochemical analysis of Nop56 in the cerebellum, hypoglossal nucleus, and spinal cord anterior horn in wild-type male Slc:ICR mice at 8 wks of age (Japan SLC, Shizuoka, Japan). The arrows indicate anti- Nop56 antibody staining. The negative control was the cerebellar sample without the Nop56 antibody treatment. Scale bar represents 100 μm. (C) Immunoblotting of Nop56 (66 kDa) in the cerebellum and cerebrum. Protein sample (10 μg) was subjected to immunoblotting. LaminB1, a nuclear protein, and beta-tubulin were used as loading controls.
Figure 5
Figure 5
Analysis of NOP56 in LCLs from SCA Patients (A) mRNA expression (upper panel) and protein levels (lower panel) in LCLs from cases (n = 6) and controls (n = 3) were measured by RT-PCR and immunoblotting, respectively. cDNA (10 ng) was transcribed from total RNA isolated from LCLs and used for RT-PCR. Immunoblotting was performed with the use of a protein sample (40 μg) extracted from LCLs. The data indicate the mean ± SD relative to the levels of PP1A and GAPDH, respectively. There was no significant difference between LCLs from controls and cases. (B) Analysis for splicing variants of NOP56 cDNA. RT-PCR with 10 ng of cDNA and primers corresponding to the region from the 5′ UTR to exon 4 around the repeat expansion was performed. The PCR product has an expected size of 230 bp. (C) Immunocytochemistry for NOP56 and coilin. Green signals represent NOP56 or coilin. Shown are representative samples from 100 observations of controls or cases.
Figure 6
Figure 6
RNA Foci Formation and Decreased Transcription of MIR1292 (A) Cells were fixed on coverslips and then hybridized with solutions containing either a Cy3-labeled C(CAGGCC)2CAG or G(CAGGCG)2CAG oligonucleotide probe (1 ng/μl). For controls, the cells were treated with 1000 U/ml DNase or 100 μg/ml RNase for 1 hr at 37°C prior to hybridization, as indicated. After a wash step, coverslips were placed on the slides in the presence of ProLong Gold with DAPI mounting media (Molecular Probes, Tokyo, Japan) and photographed with a fluorescence microscope. The upper panels indicate LCLs from an SCA case and a control hybridized with C(CAGGCC)2CAG (left) or G(CAGGCG)2CAG (right). Red and blue signals represent RNA foci and the nucleus (DAPI staining), respectively. Similar RNA foci formation was confirmed in LCLs from another index case. The lower panels show RNA foci in SCA LCLs treated with DNase or RNase. (B) Double staining was performed with the probe for (GGCCUG)n (red) and anti-SRSF2, NOP56, or coilin antibody (green). (C) Gel-shift assays revealed specific binding of SRSF2 to (GGCCUG)4 but little to (CUG)6. (D) RNA samples (10 ng) were extracted from LCLs of controls (n = 3) and cases (n = 6). MiRNAs were measured with the use of a TaqMan probe for precursor (Pri-) and mature MIR1292. The data indicate the mean ± SD, relative to the levels of PP1A or RNU6. : p < 0.05.

Similar articles

Cited by

References

    1. Harding A.E. The clinical features and classification of the late onset autosomal dominant cerebellar ataxias. A study of 11 families, including descendants of the ‘the Drew family of Walworth’. Brain. 1982;105:1–28. - PubMed
    1. Matilla-Dueñas A., Sánchez I., Corral-Juan M., Dávalos A., Alvarez R., Latorre P. Cellular and molecular pathways triggering neurodegeneration in the spinocerebellar ataxias. Cerebellum. 2010;9:148–166. - PubMed
    1. Schöls L., Bauer P., Schmidt T., Schulte T., Riess O. Autosomal dominant cerebellar ataxias: clinical features, genetics, and pathogenesis. Lancet Neurol. 2004;3:291–304. - PubMed
    1. Ohta Y., Hayashi T., Nagai M., Okamoto M., Nagotani S., Nagano I., Ohmori N., Takehisa Y., Murakami T., Shoji M. Two cases of spinocerebellar ataxia accompanied by involvement of the skeletal motor neuron system and bulbar palsy. Intern. Med. 2007;46:751–755. - PubMed
    1. Daughters R.S., Tuttle D.L., Gao W., Ikeda Y., Moseley M.L., Ebner T.J., Swanson M.S., Ranum L.P. RNA gain-of-function in spinocerebellar ataxia type 8. PLoS Genet. 2009;5:e1000600. - PMC - PubMed

Publication types

MeSH terms