. 2011 Nov;159(1):90-9.
doi: 10.1016/j.bpc.2011.05.012. Epub 2011 May 19.

Osmolyte effects on protein stability and solubility: a balancing act between backbone and side-chains

Affiliations

Osmolyte effects on protein stability and solubility: a balancing act between backbone and side-chains

Matthew Auton et al. Biophys Chem. 2011 Nov.

Abstract

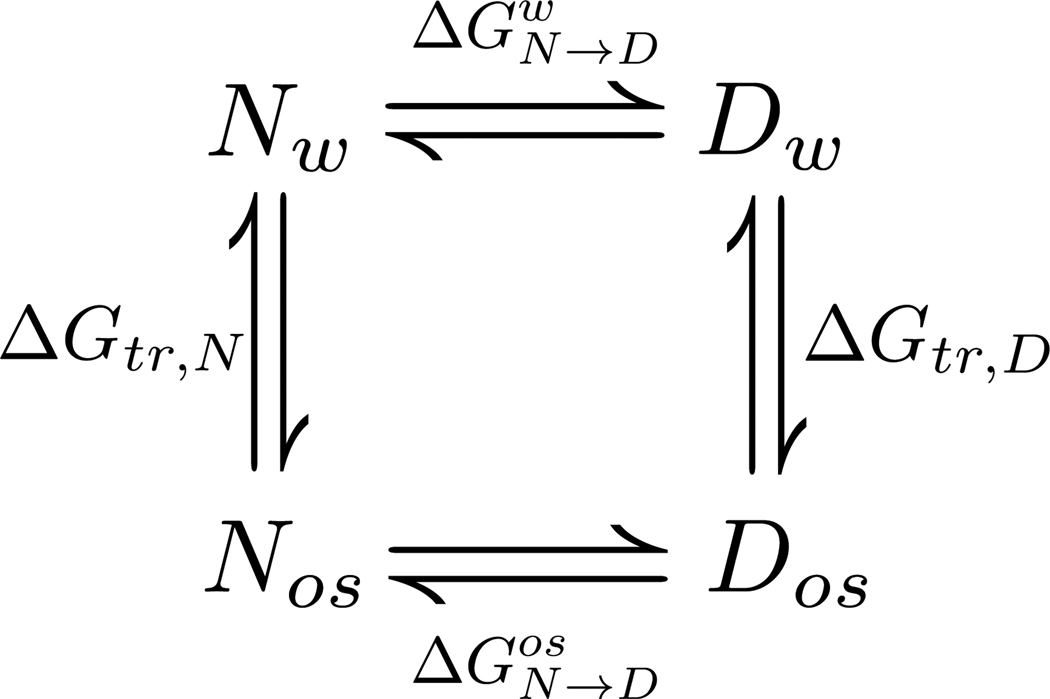
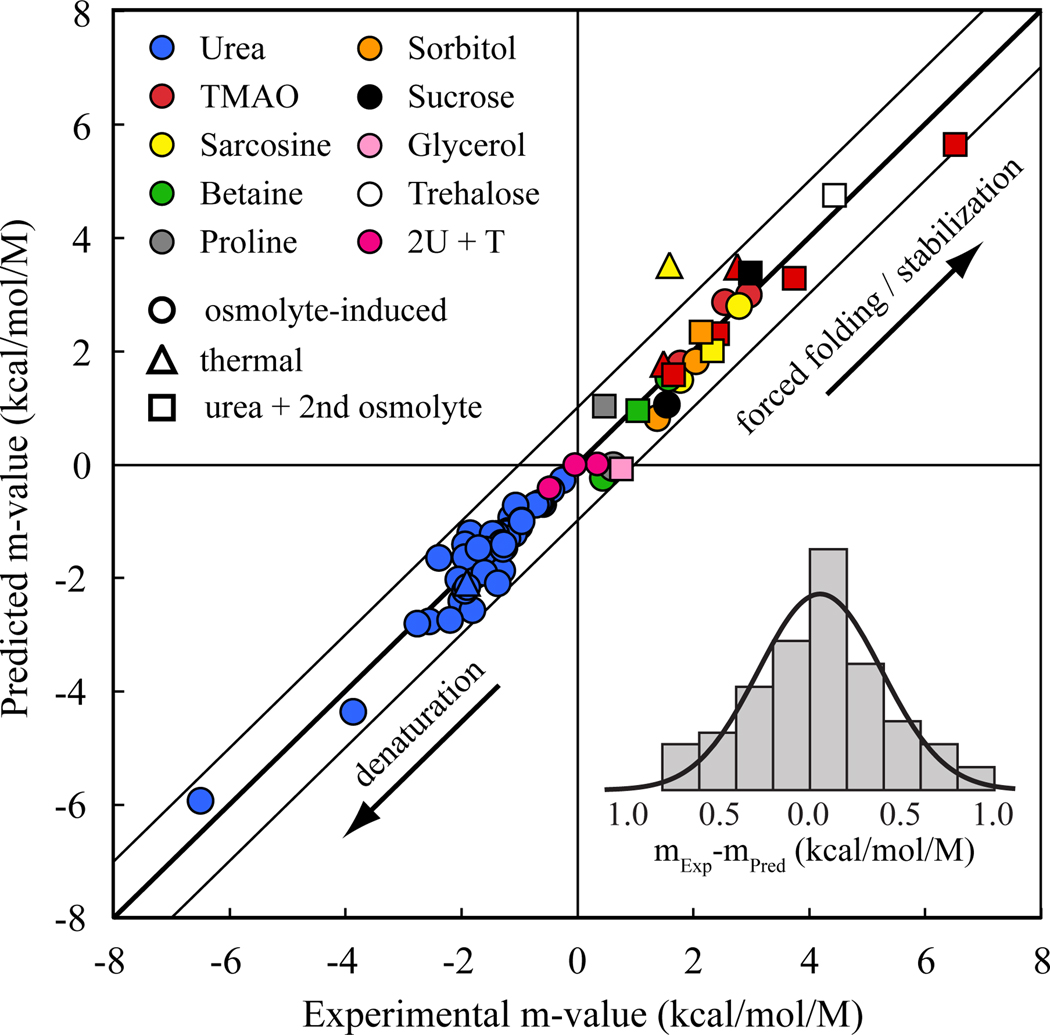
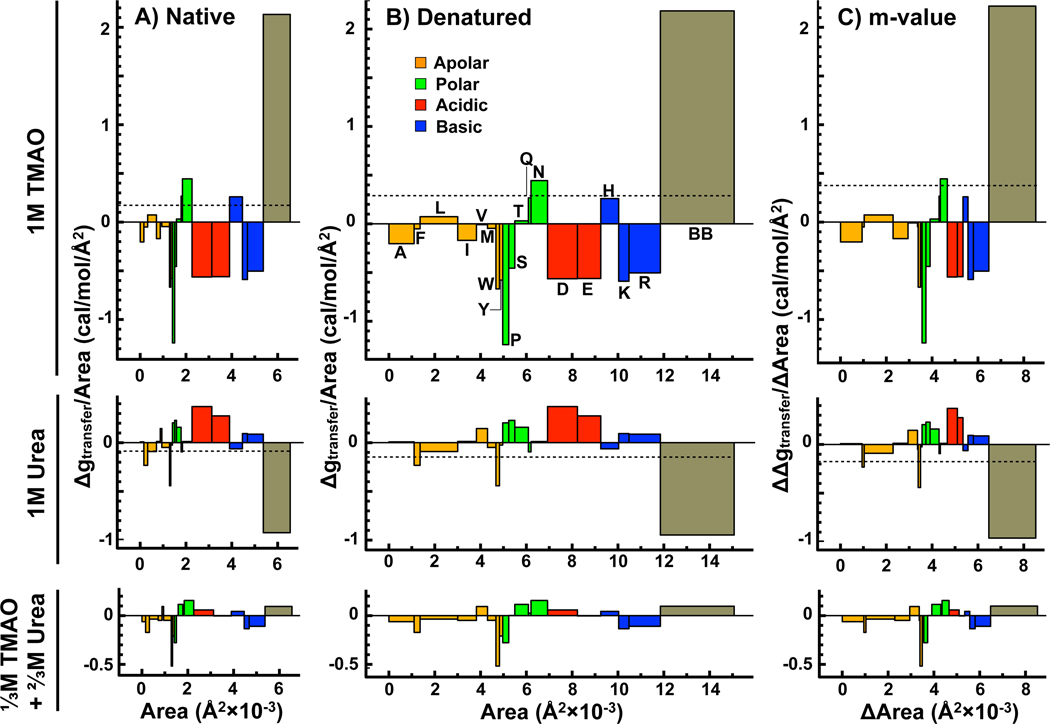
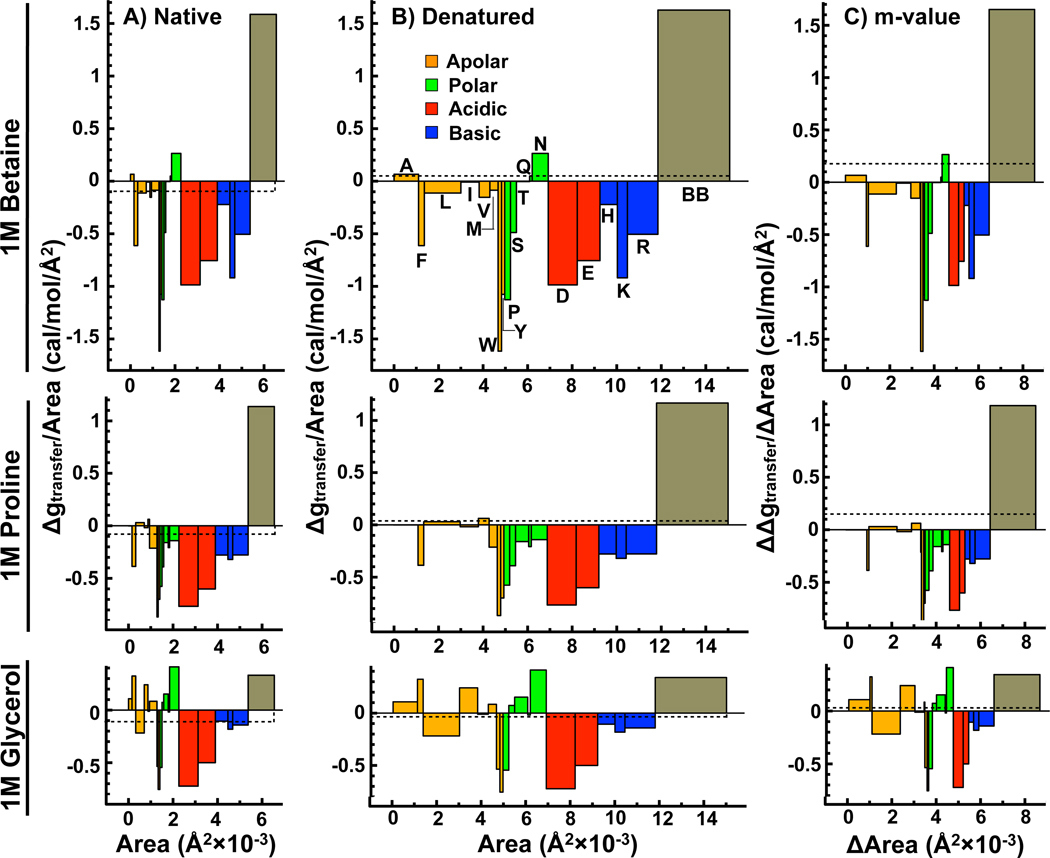
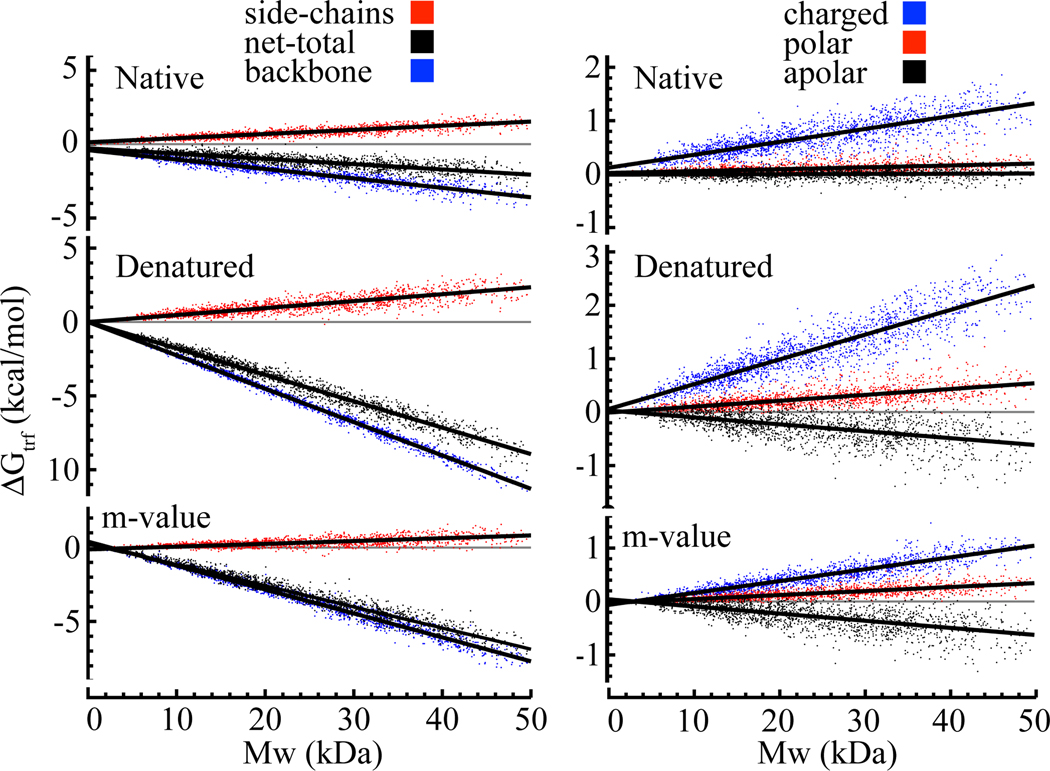
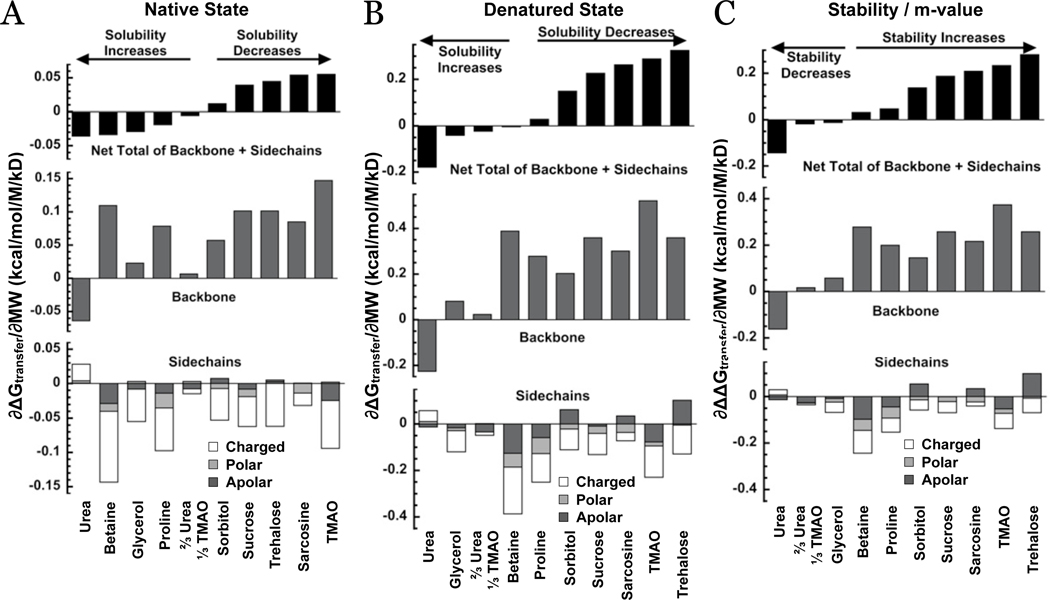
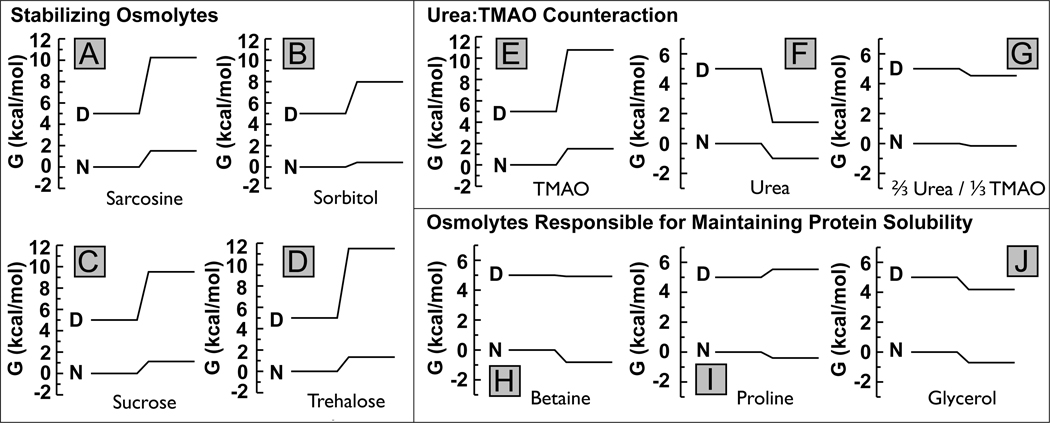
In adaptation biology the discovery of intracellular osmolyte molecules that in some cases reach molar levels, raises questions of how they influence protein thermodynamics. We've addressed such questions using the premise that from atomic coordinates, the transfer free energy of a native protein (ΔG(tr,N)) can be predicted by summing measured water-to-osmolyte transfer free energies of the protein's solvent exposed side chain and backbone component parts. ΔG(tr,D) is predicted using a self avoiding random coil model for the protein, and ΔG(tr,D)-ΔG(tr,N), predicts the m-value, a quantity that measures the osmolyte effect on the N⇌D transition. Using literature and newly measured m-values we show 1:1 correspondence between predicted and measured m-values covering a range of 12 kcal/mol/M in protein stability for 46 proteins and 9 different osmolytes. Osmolytes present a range of side chain and backbone effects on N and D solubility and protein stability key to their biological roles.


Figures

Figure 1
Figure 1. Transfer Model
Shown is a thermodynamic cycle involving (un)folding transitions between native and denatured protein in water (Nw and Dw) or osmolyte solution (Nos and Dos), as well as the transfer of native or denatured protein from water to the osmolyte solution.
Figure 2
Figure 2. Comparison of predicted m-values with experimental m-values
73 experimental data points of m-values calculated from pdb files are plotted versus their experimental values. Some experimental data were taken from the literature, and some measured using the methods described in Methods (see also supplementary Table S1). The m-values span a range of about 12 kcal/mol/M. The best fit of a straight line to the data is statistically indistinguishable from the identity line (thick diagonal line). The thin diagonal lines serve as a guide to the eye, representing deviations of ± 1 kcal/mol/M from the identity line. Almost all data fall within this limit. The distribution of the data around the identity line is shown as a histogram, with an overlaid gaussian distribution. Key: Colors indicate the osmolyte, while the symbol shapes indicate the method of determining the m-value.
Figure 3
Figure 3
Side-chain and backbone contributions to ΔGtr,N (panel A), ΔGtr,D (panel B) and the m-value (panel C) of Nank4 − 7* from buffer to 1M TMAO (top), 1M urea (middle) and the 2:1 mixture of urea to TMAO equal to unit molarity (bottom). Side-chain and backbone transfer free energy contributions divided by the corresponding surface areas exposed in the native and denatured state (Δgtr/Area) are plotted as a function of those solvent exposed surface areas. Side-chain and backbone contributions to the m-value divided by their respective contributions to ΔArea as a function of total surface area newly buried upon forced folding or exposed upon unfolding. The net transfer free energy per Å2 for native, denatured and overall m-value are shown as dashed lines. Amino acid side-chain contributions are labeled according to their single letter abbreviation and colored by class as indicated in panel B (top) and their order on the abscissa is preserved in all panels of this figure. For ease of comparison, the scale of both the ordinate and abscissa in all panels are equal. (Colors: Web only)
Figure 4
Figure 4
Side-chain and backbone contributions to ΔGtr,N (panel A), ΔGtr,D (panel B) and the m-value (panel C) of Nank4 − 7* from buffer to 1M glycine betaine (top), 1M proline (middle) and 1M glycerol (bottom). See Figure 3 for details. (Colors: Web only)
Figure 5
Figure 5. Calculated transfer free energy of proteins of various size to 1M Urea
Left: Contribution of backbone and side-chains to the total transfer free energy of the native state (top), denatured state (middle) and the m-value (bottom) as a function of molecular weight. Right: Contribution of charged, polar and apolar side-chains to the total side-chain transfer free energy of the native state (top), denatured state (middle) and the m-value (bottom) as a function of molecular weight. The order of labels in the keys is the same as the order of the curves in all panels below each key. (Colors: web only)
Figure 6
Figure 6
The slope of ΔGtr with respect to protein molecular weight for the native state (panel A), denatured state (panel B) and m-value (panel C). The total transfer free energy contributions are given at the (top), the total backbone contribution (middle) and the total contribution of side-chains (bottom). The total side-chain contributions are further split into their charged, polar and apolar classes. Osmolytes are ranked according to the net total.
Figure 7
Figure 7
Free energy diagrams for each of the osmolytes indicated based on an average protein of molecular weight = 20kD calculated from Supplemental Figures S1–S9; diagrams of individual proteins may vary somewhat from the average. Initial stability in the absence of osmolyte is set at 5 kcal/mol. In each diagram, the left side represents 0M osmolyte, and the right side 1M. A decrease of the absolute value means an increase in solubility, and vice versa. An increase in the gap between native and denatured gibbs free energy translates to an increase in stability.

References

    1. Hochachka P, Somero G. Mechanism and Process in Physiological Evolution. Oxford: Oxford University Press; 2002. Biochemical Adaptation.
    1. Yancey PH, Somero G. Counteraction of urea destabilization of protein structure by methylamine osmoregulatory compounds of elasmobranch fishes. Biochem. J. 1979;183(2):317–323. - PMC - PubMed
    1. Yancey P, Clark M, Hand S, Bowlus R, Somero G. Living with water stress: Evolution of osmolyte systems. Science. 1982;217(4566):1214–1222. - PubMed
    1. Somero G. Protons, osmolytes, and fitness of internal milieu for protein function. Am. J. Physiol. 1986;251(2 Pt 2):R197–R213. - PubMed
    1. Gillett MB, Suko JR, Santoso FO, Yancey PH. Elevated levels of trimethylamine oxide in muscles of deep-sea gadiform teleosts: A high-pressure adaptation? J. Exp. Zool. 1997;279:386–391.

Publication types

LinkOut - more resources