Review
. 2011 Oct;21(5):752-60.
doi: 10.1016/j.conb.2011.05.016. Epub 2011 Jun 16.

Efficient computation via sparse coding in electrosensory neural networks

Affiliations
Review

Efficient computation via sparse coding in electrosensory neural networks

Maurice J Chacron et al. Curr Opin Neurobiol. 2011 Oct.

Abstract

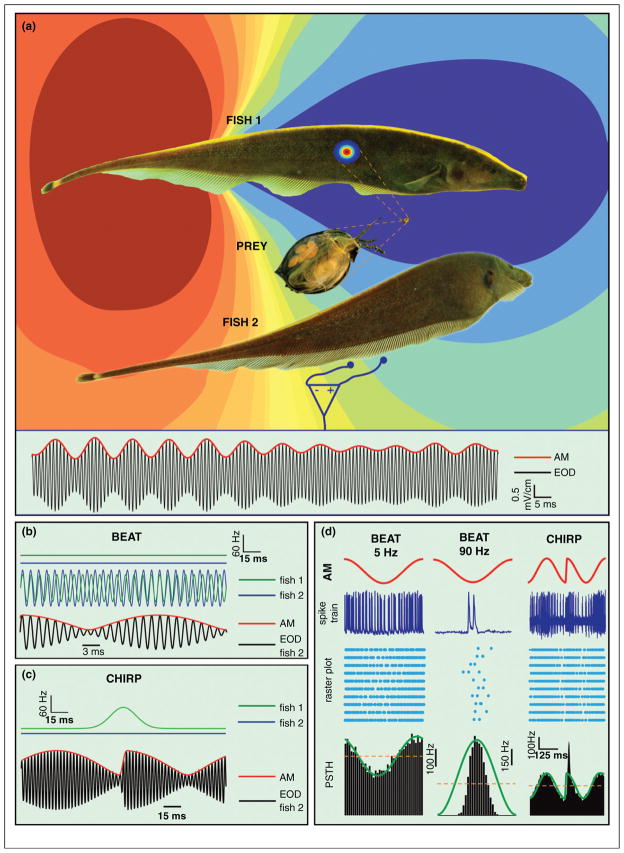
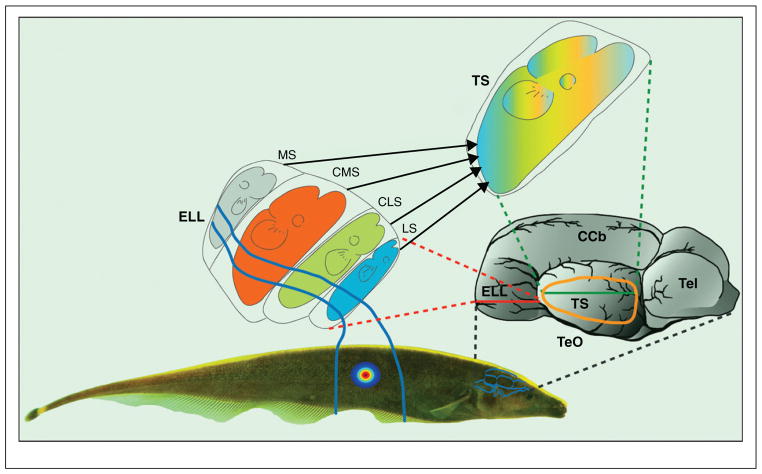
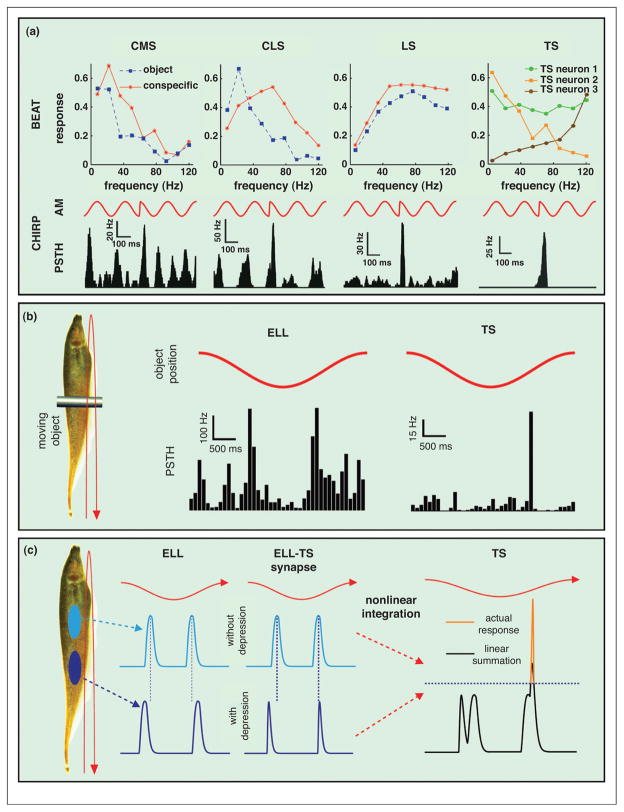
The electric sense combines spatial aspects of vision and touch with temporal features of audition. Its accessible neural architecture shares similarities with mammalian sensory systems and allows for recordings from successive brain areas to test hypotheses about neural coding. Further, electrosensory stimuli encountered during prey capture, navigation, and communication, can be readily synthesized in the laboratory. These features enable analyses of the neural circuitry that reveal general principles of encoding and decoding, such as segregation of information into separate streams and neural response sparsification. A systems level understanding arises via linkage between cellular differentiation and network architecture, revealed by in vitro and in vivo analyses, while computational modeling reveals how single cell dynamics and connectivity shape the sparsification process.


Figures

Figure 1
Figure 1. Spatio-temporal content of electrosensory signals varies based on the behavioral context
(a) Images of Apteronotus leptorhynchus (brown ghost knife fish). The electric field generated by Fish 1’s electric organ discharge (EOD) varies sinusoidally in time at a constant high frequency (species range: ~650–1000 Hz) and is seen at the peak of its head negative phase. A prey distorts the EOD to create an ‘electric image’ on the skin. A conspecific (Fish 2) also generates an EOD (not shown) that interferes with fish 1’s EOD. A small dipole and amplifier placed near the skin of Fish 2 shows the electrical signal (black) from both fish as indicated in the trace at the bottom. Also shown is time varying amplitude of the signal (red). (b) When two fish with different EOD frequencies (upper traces) are located close to one another, the EODs of each fish (middle traces) show alternating regions of constructive and destructive interference, which leads to a sinusoidal amplitude modulation (SAM, red) or a beat with frequency equal to the difference of the individual fish’s EOD frequencies (lower trace) for the summed signal (black). (c) Weakly electric fish can emit communication signals known as chirps that consist of a transient increase in its EOD frequency (upper traces) when close to a conspecific. As a result, the SAM frequency increases transiently which leads to a phase reset of the beat (lower traces). (d) Electroreceptor afferents respond differentially to time varying AMs characteristic of beats and chirps. For low (~5 Hz) frequencies, the afferent’s baseline firing rate is smoothly modulated by the beat (left panel) and in excellent agreement with the response predicted from a linear system. For high (~90 Hz) frequencies, afferents display nonlinear phase locking (middle panel) in that the afferent only fires near a preferred phase of the SAM; this is quite different than what would be predicted from a linear system (green line). For chirps, the resulting phase reset of the beat is a high frequency stimulus that causes a greater transient increase in firing rate than expected from a linear prediction (green line) as seen in the PSTH. This translates to a transient synchronization at the population level.
Figure 2
Figure 2. Anatomy of the electrosensory system
The image at the right is a side view of the A. leptorhynchus brain with rostral to the right. The key electrosensory structures are the hypertrophied electrosensory lateral line lobe (ELL) within the rhombencephalon and torus semicircularis (TS) within the mesencephalon. The outline of the TS is indicated by the orange ovoid, but this structure is actually located interior to the external optic tectum (TeO). A horizontal slice through the ELL is shown near the middle of the figure. Electroreceptor afferents project only to the ipsilateral ELL where they form four parallel topographic maps, each within its own ELL segment. For each map, the head of the fish is represented rostrally in ELL, while the trunk is represented caudally. The dorso-ventral axis of the fish is represented along the medio-lateral axis of each map. The four segments are: medial (MS), centromedial (CMS), centrolateral (CLS) and lateral (LS). Passive electroreceptors project strictly to MS (not further considered). Each active electroreceptor afferent trifurcates to provide identical input to the CMS, CLS and LS maps. However, as indicated in this figure, the sizes of the maps are very different with CMS > CLS > LS. All four ELL maps converge onto the midbrain TS. Thus, the TS contains a single topographic map of the entire body surface. CCb – corpus cerebellum; Tel – telencephalon.
Figure 3
Figure 3. Emergence of sparse coding in the hindbrain and further specialization in midbrain
(a) (Top) Tuning curves from example pyramidal neurons from the CMS (left), CLS (middle), LS (right), and TS (far right) under spatially localized (mimicking an object, blue) and spatially diffuse (mimicking a conspecific, red) stimulation. While CMS neurons tend to be tuned to low (<20 Hz) frequencies under both stimulation geometries, CLS neurons tend to switch their tuning contingent on stimulation geometry. LS neurons are tuned instead to higher (~80 Hz) frequencies. TS neurons display large heterogeneities in their tuning: some neurons are tuned to low frequencies, others display more broadband tuning while others are tuned to high frequencies. The differential tuning across the ELL segments is manifested in the responses to small chirps (bottom). Indeed, LS neurons show the strongest response while CMS shows the weakest. Some TS neurons respond selectively to chirps. (b) Left: Schematic showing an object (metal bar) moving back and forth sinusoidally along the animal’s rostro-caudal axis. Right: Example responses from ELL (left) and TS (right) neurons to a moving object. ELL neurons strongly respond when the object is at a given position along the animal independently of movement direction. By contrast, TS neurons display directional selectivity and can respond only when the object moves in a given direction. (c) The mechanism by which TS neurons acquire directional selectivity involves combining the responses of two ELL neurons (blue and cyan) whose receptive fields are located at different positions along the animal’s body. The ELL neurons will respond at different phases of the object’s movement in a directionally independent fashion, thereby creating a time delay between their responses. However, differential filtering alters the output of one ELL neuron through high-pass filtering (dark blue) but does not affect the other (cyan), which can reduce the time delay is one direction and increase it in the other. This causes a greater overlap between the ELL neuron responses and thus a greater depolarization in the preferred movement direction and less overlap and depolarization in the other direction. The increased depolarization in the preferred direction can then activate subthreshold T-type calcium channels that then further increase the response in the head-to-tail but not in the tail-to-head direction (orange), thereby explaining the directionally selective responses in TS neurons.

Similar articles

Cited by

References

    1. Barlow HB. Single Units and sensation: a neuron doctrine for perceptual psychology. Perception. 1972;1:371–394. - PubMed
    1. Rolls ET, Tovee MJ. Sparseness of the neuronal representation of stimuli in the primate temporal visual cortex. J Neurophysiol. 1995;73:713–726. - PubMed
    1. Quiroga RQ, Reddy L, Kreiman G, Koch C, Fried I. Invariant visual representation by single neurons in the human brain [see comment] Nature. 2005;435:1102–1107. - PubMed
    1. Perez-Orive J, Mazor O, Turner GC, Cassenaer S, Wilson RI, Laurent G. Oscillations and sparsening of odor representations in the mushroom body. Science. 2002;297:359–365. - PubMed
    1. Olshausen BA, Field DJ. Sparse coding of sensory inputs. Curr Opin Neurobiol. 2004;14:481–487. - PubMed

Publication types