

Body mass index is associated with biological CSF markers of core brain pathology of Alzheimer's disease
- PMID: 21684041
- PMCID: PMC3208117
- DOI: 10.1016/j.neurobiolaging.2011.05.005
Body mass index is associated with biological CSF markers of core brain pathology of Alzheimer's disease
Abstract
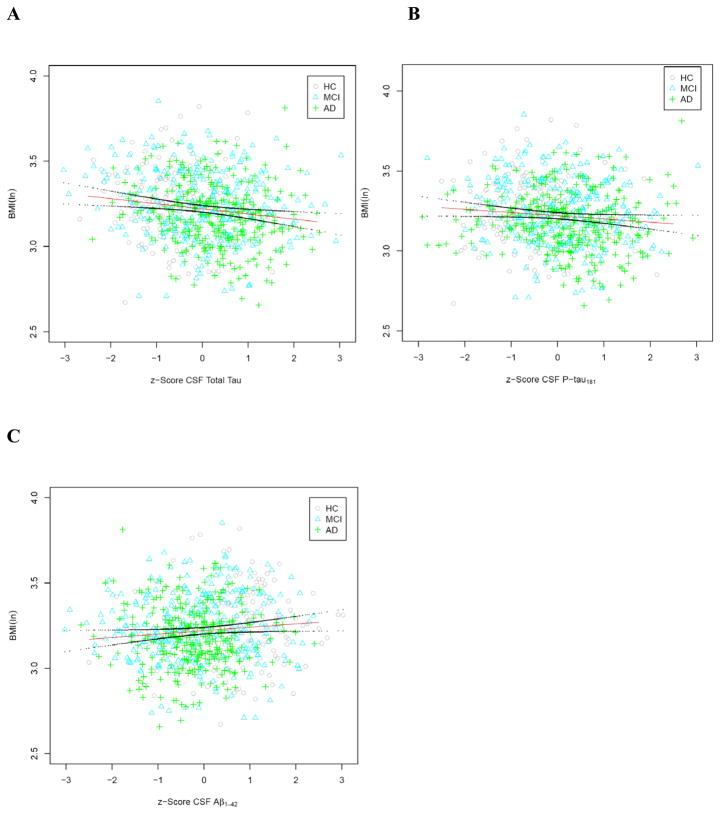
Weight changes are common in aging and Alzheimer's disease (AD) and postmortem findings suggest a relation between lower body mass index (BMI) and increased AD brain pathology. In the current multicenter study, we tested whether lower BMI is associated with higher core AD brain pathology as assessed by cerebrospinal fluid (CSF)-based biological markers of AD in 751 living subjects: 308 patients with AD, 296 subjects with amnestic mild cognitive impairment (MCI), and 147 elderly healthy controls (HC). Based upon a priori cutoff values on CSF concentration of total tau and beta-amyloid (Aβ(1-42)), subjects were binarized into a group with abnormal CSF biomarker signature (CSF+) and those without (CSF-). Results showed that BMI was significantly lower in the CSF+ when compared with the CSF- group (F = 27.7, df = 746, p < 0.001). There was no interaction between CSF signature and diagnosis or apolipoprotein E (ApoE) genotype. In conclusion, lower BMI is indicative of AD pathology as assessed with CSF-based biomarkers in demented and nondemented elderly subjects.
Published by Elsevier Inc.
Conflict of interest statement
Conflict of interest: Dr. Weiner has been on advisory boards for Lilly, Araclon and Institut Catala de Neurociencies Aplicades, Gulf War Veterans Illnesses Advisory Committee, VACO, Biogen Idec, Elan/Wyeth Alzheimer’s Immunotherapy Program North American Advisory Board, Novartis Misfolded Protein Scientific Advisory Board Meeting, Banner Alzheimer’s Institute Alzheimer’s Prevention Initiative Advisory Board Meeting, and the Research Advisory Committee on Gulf War Veterans’ Illnesses. He has been a consultant for Elan/Wyeth, Novartis, Forest, Ipsen, Daiichi Sankyo, Inc., Astra Zeneca, Araclon, Medivation/Pfizer, TauRx Therapeutics LTD, Bayer Healthcare, Biogen Idec, Exonhit Therapeutics, SA, Servier, and Synarc. He serves on the Alzheimer’s & Dementia Editorial Board. Dr. Weiner has received research support from Merck, Avid, the NIH, the DOD, and the VA, and holds stock options with Synarc and Elan. All other authors report no conflict of interest.
Figures


Comment in
-
Body mass index is associated with biological CSF markers of core brain pathology in Alzheimer's disease.Neurobiol Aging. 2012 Jul;33(7):e1-2. doi: 10.1016/j.neurobiolaging.2011.12.012. Epub 2012 Jan 13. Neurobiol Aging. 2012. PMID: 22244089 No abstract available.
References
-
- Barrett-Connor E, Edelstein S, Corey-Bloom J, Wiederholt W. Weight loss precedes dementia in community-dwelling older adults. Journal of Nutrition, Health and Aging. 1998;2(2):113–4. - PubMed
-
- Berlinger WG, Potter JF. Low Body Mass Index in demented outpatients. J Am Geriatr Soc. 1991;39(10):973–8. - PubMed
-
- Blennow K, de Leon MJ, Zetterberg H. Alzheimer’s disease. Lancet. 2006;368(9533):387–403. - PubMed
-
- Blennow K, Hampel H. CSF markers for incipient Alzheimer’s disease. Lancet Neurol. 2003;2(10):605–13. - PubMed
Publication types
MeSH terms
Substances
Grants and funding
- R01AG10897/AG/NIA NIH HHS/United States
- P30 AG013846/AG/NIA NIH HHS/United States
- P41 RR023953/RR/NCRR NIH HHS/United States
- P30 AG010129/AG/NIA NIH HHS/United States
- P30 AG019610/AG/NIA NIH HHS/United States
- UL1 TR001998/TR/NCATS NIH HHS/United States
- P41RR023953/RR/NCRR NIH HHS/United States
- UL1 TR000117/TR/NCATS NIH HHS/United States
- K01 AG030514/AG/NIA NIH HHS/United States
- U01 AG024904/AG/NIA NIH HHS/United States
- U19 AG010483/AG/NIA NIH HHS/United States
- R01 AG010897/AG/NIA NIH HHS/United States
- UL1 RR033173/RR/NCRR NIH HHS/United States
LinkOut - more resources
Full Text Sources
Medical
Miscellaneous
