. 2011 Jul 1;27(13):i288-94.
doi: 10.1093/bioinformatics/btr221.

Mixed-model coexpression: calculating gene coexpression while accounting for expression heterogeneity

Affiliations

Mixed-model coexpression: calculating gene coexpression while accounting for expression heterogeneity

Nicholas A Furlotte et al. Bioinformatics. .

Abstract

Motivation: The analysis of gene coexpression is at the core of many types of genetic analysis. The coexpression between two genes can be calculated by using a traditional Pearson's correlation coefficient. However, unobserved confounding effects may cause inflation of the Pearson's correlation so that uncorrelated genes appear correlated. Many general methods have been suggested, which aim to remove the effects of confounding from gene expression data. However, the residual confounding which is not accounted for by these generic correction procedures has the potential to induce correlation between genes. Therefore, a method that specifically aims to calculate gene coexpression between gene expression arrays, while accounting for confounding effects, is desirable.

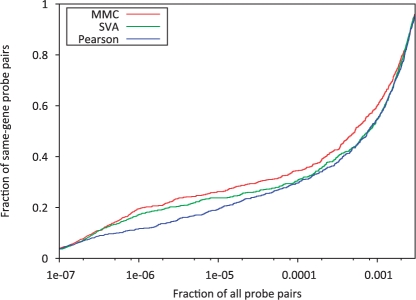
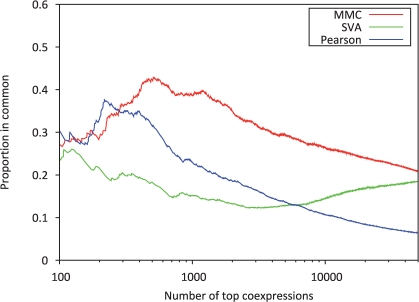
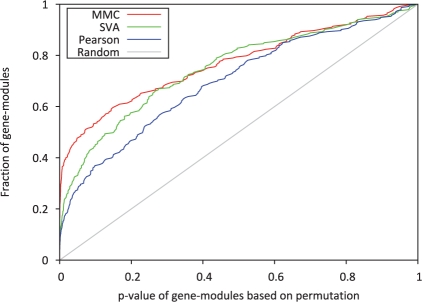
Results: In this article, we present a statistical model for calculating gene coexpression called mixed model coexpression (MMC), which models coexpression within a mixed model framework. Confounding effects are expected to be encoded in the matrix representing the correlation between arrays, the inter-sample correlation matrix. By conditioning on the information in the inter-sample correlation matrix, MMC is able to produce gene coexpressions that are not influenced by global confounding effects and thus significantly reduce the number of spurious coexpressions observed. We applied MMC to both human and yeast datasets and show it is better able to effectively prioritize strong coexpressions when compared to a traditional Pearson's correlation and a Pearson's correlation applied to data corrected with surrogate variable analysis (SVA).

Availability: The method is implemented in the R programming language and may be found at http://genetics.cs.ucla.edu/mmc.

Contact: nfurlott@cs.ucla.edu; eeskin@cs.ucla.edu.


Figures

Fig. 1.
Fig. 1.
The distributions of coexpression ranks for a set of 732 probe pairs, for which both probes in a pair target the same gene. The coexpression values for each probe pair are ranked with respect to all other pairwise coexpression values. Smaller ranks indicate higher coexpression. We expect that probes targeting the same gene should be highly coexpressed and therefore should have very low rank. The MMC method consistently ranks these coexpressions lower when compared to the other two methods.
Fig. 2.
Fig. 2.
Comparison of the concordance between two yeast datasets for both methods Concordance between two sets of coexpressions is compared by looking at the proportion of coexpressions in common for the top ranking coexpressions. The x-axis represents the number of top ranked coexpressions considered, while the y-axis represents the proportion of those coexpressions that are common between the new and old dataset.
Fig. 3.
Fig. 3.
Distribution of gene-module P-values for Pearson, SVA and MMC. We used a set of 233 known functional modules consisting of sets of genes of size 2 to 20. For each of these modules, a P-value representing the biological significance is calculated. This figure plots the distributions of these P-values. Since the P-values were calculated for gene sets known to be functionally related, we expect that there should be an inflation of significant P-values. It can be seen that the MMC method produces a larger number of significant P-values when compared to both the traditional Pearson and SVA-corrected coexpressions.

References

    1. Balázsi G., et al. Spurious spatial periodicity of co-expression in microarray data due to printing design. Nucleic Acids Res. 2003;31:4425–4433. - PMC - PubMed
    1. Brem R.B., et al. Genetic dissection of transcriptional regulation in budding yeast. Science. 2002;296:752–755. - PubMed
    1. Clarke R., et al. The properties of high-dimensional data spaces: implications for exploring gene and protein expression data. Nat. Rev. Cancer. 2008;8:37–49. - PMC - PubMed
    1. Devlin B., et al. Genomic control, a new approach to genetic-based association studies. Theor. Popul. Biol. 2001;60:155–166. - PubMed
    1. Ghanzalpour A., et al. Integrating genetic and network analysis to characterize gene related to mouse weight. PLoS Genet. 2006;2:e130. - PMC - PubMed

Publication types