. 2011 Jun;23(6):2331-47.
doi: 10.1105/tpc.111.087205. Epub 2011 Jun 17.

Maize opaque5 encodes monogalactosyldiacylglycerol synthase and specifically affects galactolipids necessary for amyloplast and chloroplast function

Affiliations

Maize opaque5 encodes monogalactosyldiacylglycerol synthase and specifically affects galactolipids necessary for amyloplast and chloroplast function

Alan M Myers et al. Plant Cell. 2011 Jun.

Abstract

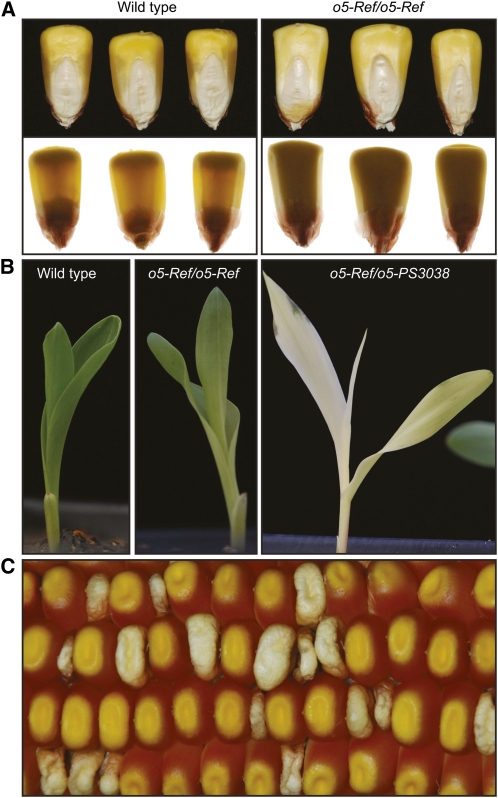
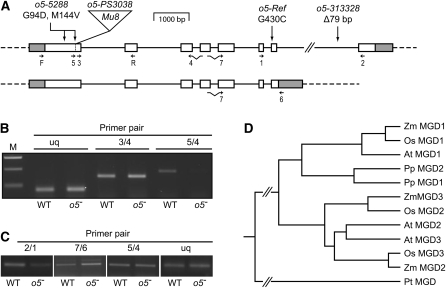
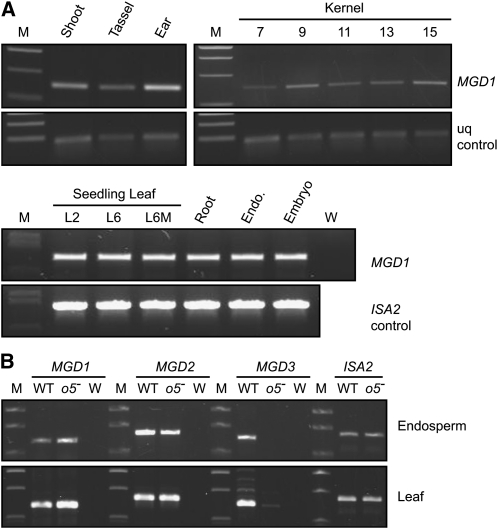
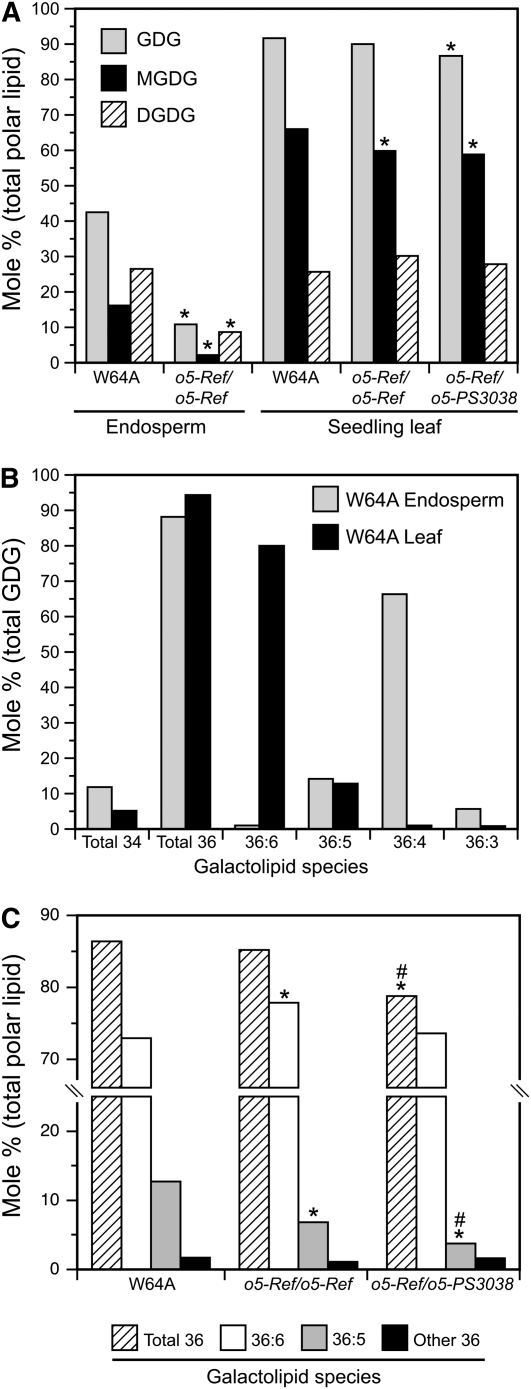
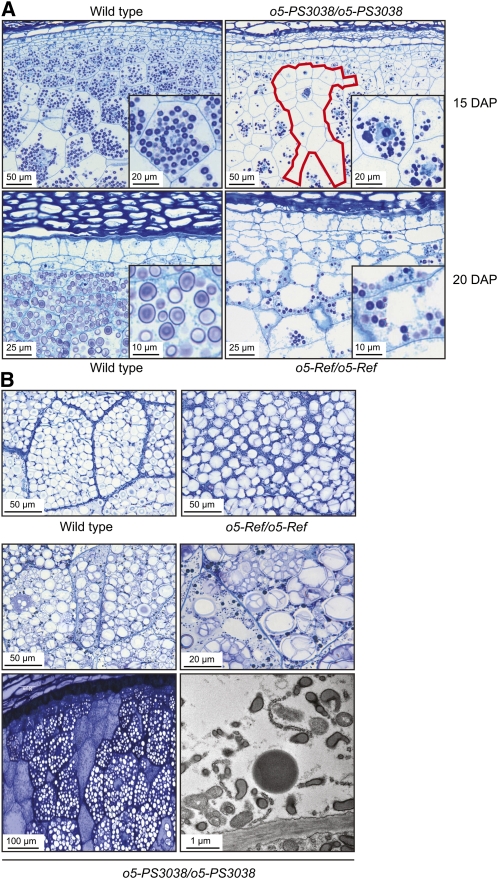
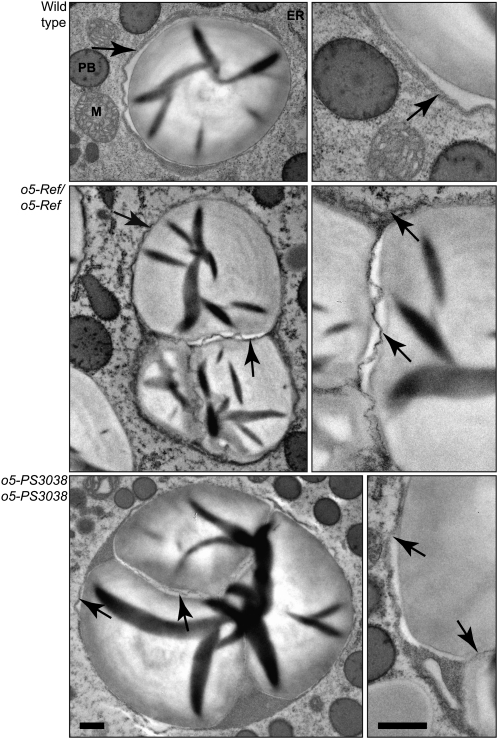
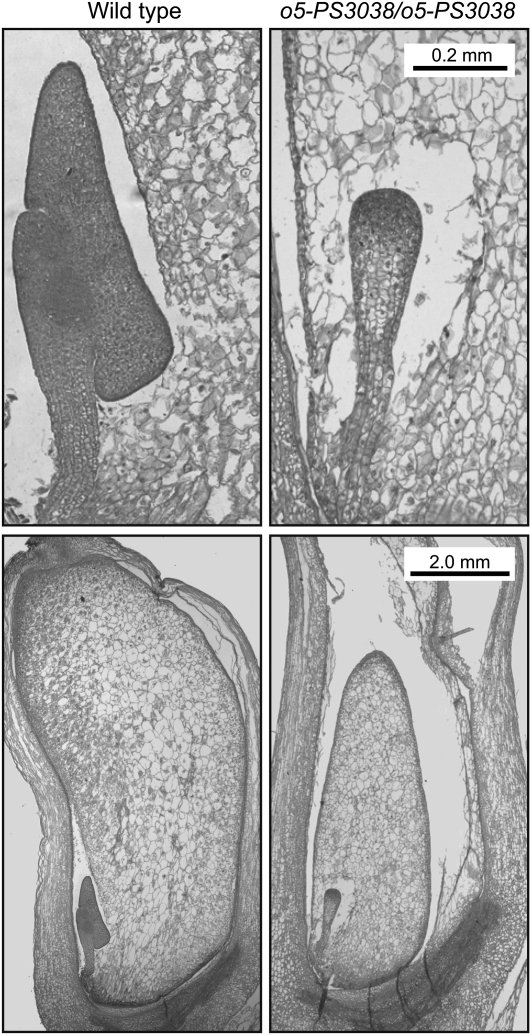
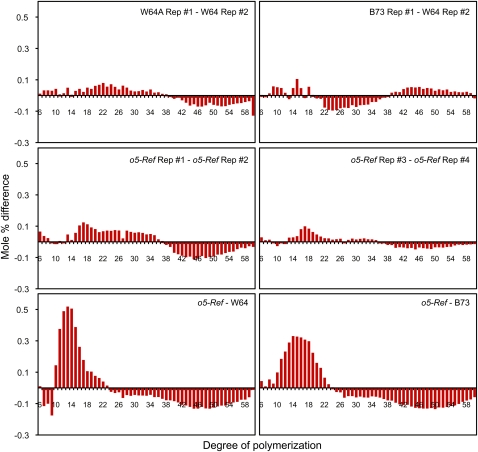
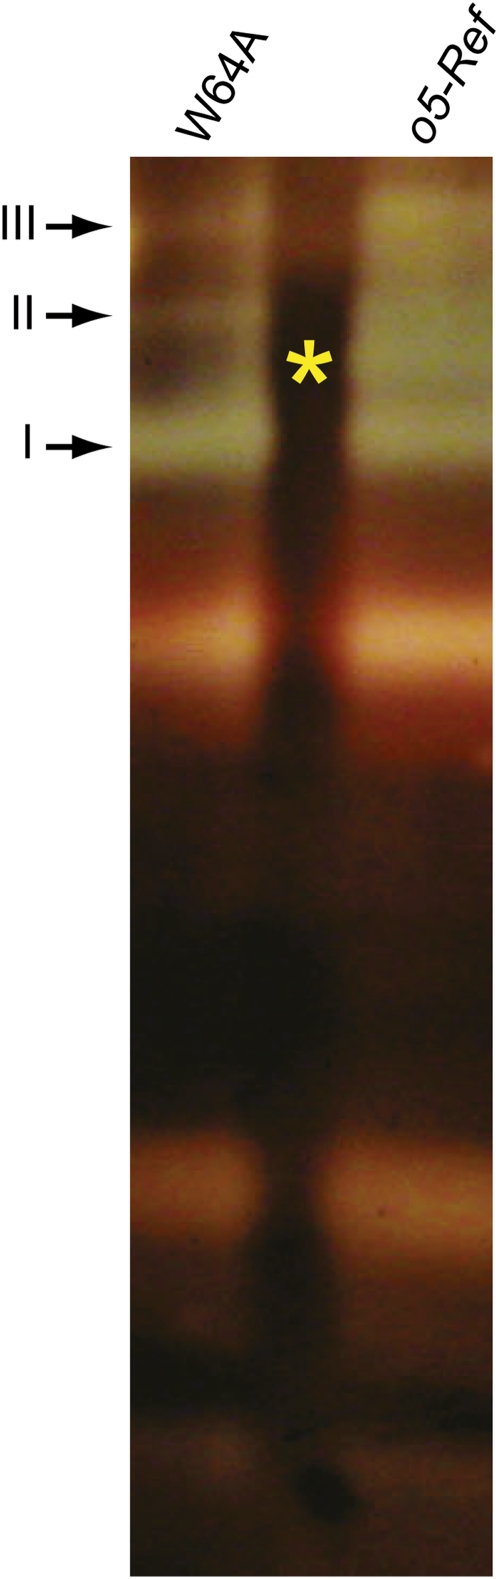
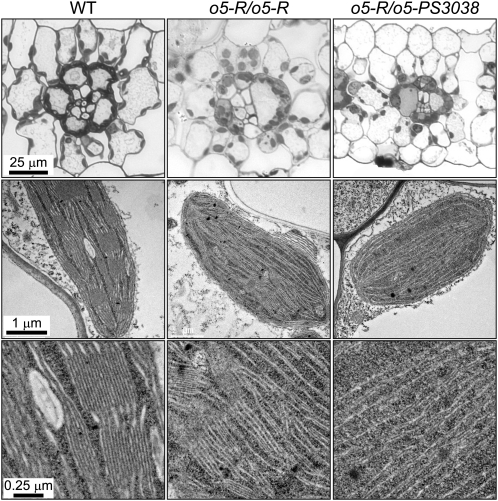
The maize (Zea mays) opaque5 (o5) locus was shown to encode the monogalactosyldiacylglycerol synthase MGD1. Null and point mutations of o5 that affect the vitreous nature of mature endosperm engendered an allelic series of lines with stepwise reductions in gene function. C(18:3)/C(18:2) galactolipid abundance in seedling leaves was reduced proportionally, without significant effects on total galactolipid content. This alteration in polar lipid composition disrupted the organization of thylakoid membranes into granal stacks. Total galactolipid abundance in endosperm was strongly reduced in o5(-) mutants, causing developmental defects and changes in starch production such that the normal simple granules were replaced with compound granules separated by amyloplast membrane. Complete loss of MGD1 function in a null mutant caused kernel lethality owing to failure in both endosperm and embryo development. The data demonstrate that low-abundance galactolipids with five double bonds serve functions in plastid membranes that are not replaced by the predominant species with six double bonds. Furthermore, the data identify a function of amyloplast membranes in the development of starch granules. Finally, the specific changes in lipid composition suggest that MGD1 can distinguish the constituency of acyl groups on its diacylglycerol substrate based upon the degree of desaturation.


Figures

Figure 1.
Figure 1.
Kernel and Seedling Phenotypes. (A) o5-Ref kernel phenotype. Mature kernels from a self-pollinated ear of an o5-Ref/+ heterozygote were photographed under reflected light (black background) or backlit by a transilluminator (white background). (B) Seedling phenotypes. Kernels of the indicated genotype were planted in the greenhouse, and seedlings were photographed 7 d after emergence. (C) o5-PS3038 kernel phenotype. A portion of a self-pollinated ear from an o5-PS3038/+ heterozygote is shown. Homozygous mutant kernels are variable in size, often shriveled, floury in texture, and carotenoid deficient.
Figure 2.
Figure 2.
Characterization of the o5 Locus. (A) Locus structure. Introns are shown as solid lines, exons as boxes, and untranslated regions as gray boxes. Mutation sites are indicated. Small arrows indicate the locations of oligonucleotide primers used in RT-PCR analyses in (B) and (C). The figure is drawn to scale except for intron 7, which is ~3.1 kb. The top diagram maps the transcript that appears most frequently in EST data, and the bottom diagram maps an alternative transcript that fails to remove intron 7 and uses a different 3′ end processing site. (B) Transcript accumulation in o5-PS3038 kernels. MGD1 mRNA was detected by RT-PCR in wild-type (WT) and o5-PS3038/o5-PS3038 kernels (designated o5-) harvested from a segregating ear at 15 DAP. Primers locations are shown in (A). The ubiquitin (uq) gene transcript was used as a positive control. M, molecular weight standards. (C) Transcript accumulation in o5-313328 kernels. Analysis as in (B). (D) Phylogenetic relationship of MGD genes. The o5 gene product (shown as Zm MGD1) was aligned with MGD proteins from maize, rice, Arabidopsis, the moss Physcomitrella patens, and the diatom P. tricornutum. GenBank protein accession numbers are listed in Methods.
Figure 3.
Figure 3.
RT-PCR Analysis of Transcript Levels. (A) Expression of MGD1 mRNA in wild-type tissues. RNA from the indicated tissues was amplified using primers specific for the MGD1 transcript. The ubiquitin (uq) or ISA2 transcripts were used as controls. M, molecular weight standards. W, no template control. Shoot and root were from seedlings. Ear tissue was from early development when the organ was ~2 mm in length. Whole kernels were analyzed at the indicated days after pollination. L2, leaf from two-leaf seedlings; L6, youngest leaf of six-leaf seedlings; L6M, mature seedling leaf defined as the outer one-third of the third leaf of six-leaf seedlings. Endosperm and embryo were from kernels harvested 20 DAP. In the top panel, primers 3 and 4 were used to amplify cDNA, and in the bottom panel, the primers were F and R. The locations of the primers are shown in Figure 2A. (B) Expression of MGD1, MGD2, and MGD3 mRNAs in wild-type and o5-Ref tissues. Total RNA from endosperm or leaf was amplified using primers specific for the indicated transcript. The ISA2 transcript provided a positive control. M, molecular weight standards; WT, wild-type inbred W64A; o5-, plants homozygous for o5-Ref; W, no template control.
Figure 4.
Figure 4.
Lipid Content. (A) Galactolipid species abundance in leaf and endosperm of the wild type and o5- mutants. MGDG, DGDG, and total GDG abundance is plotted as the molar percentage of total polar lipid. Values are averages of independent biological replicates (W64A endosperm, n = 4; o5-Ref/o5-Ref endosperm, n = 5; all seedling leaf tissue, n = 3; sd ≤ 2.1%). Asterisks indicate significant differences from the wild type (P < 0.01; Student's t test). Differences between o5-Ref/o5-Ref and o5-Ref/o5-PS3038 were not observed at this level of significance. (B) Degree of desaturation in galactolipids of wild-type leaf and endosperm. Galactolipid species abundance is plotted as the molar percentage of total galactolipid. Independent replicates were as in (A) (sd ≤ 0.6%). (C) Comparison of the degree of desaturation in galactolipids of wild-type and o5- mutant leaves. Galactolipid species abundance is plotted as the molar percentage of total polar lipid. Independent replicates were as in (A) (sd ≤ 1.6% for all samples and ≤0.6% for 36:5 species). Asterisks indicate significant differences from the wild-type value, and pound signs indicate significant differences from the o5-Ref/o5-Ref value (P < 0.01; Student's t test).
Figure 5.
Figure 5.
Endosperm Development. (A) Histological sections of immature endosperm. Wild-type and mutant kernels were collected at 15 DAP from a self-pollinated o5-PS3038/+ plant and at 20 DAP from a self-pollinated o5-Ref/+ plant. A cluster of cells in o5-PS3038/o5PS3038 endosperm largely devoid of starch grains is outlined in red. (B) Histological sections of mature endosperm. Mature kernels were collected from the plants described in (A) and either fixed for histological analysis by light microscopy or embedded, thin-sectioned, and analyzed by TEM (bottom right panel). The TEM image depicts a cell from a region of o5-PS3038/o5PS3038 endosperm devoid of starch granules (bottom left panel).
Figure 6.
Figure 6.
TEM Visualization of Mature Starch Grains in Endosperm Tissue. Kernels on self-pollinated ears of o5-Ref/+ or o5-PS3038/+ heterozygotes were harvested at maturity, fixed, thin-sectioned, and analyzed by TEM. Dark-staining areas within granules are folds that arise during sectioning. Arrows indicate amyloplast envelope or internal membrane. Bars = 0.5 μm and apply uniformly within each column. Organelles are indicated: M, mitochondria; PB, protein bodies.
Figure 7.
Figure 7.
Embryo Development. Wild-type and homozygous o5-PS3808 kernels harvested from a segregating ear at 15 DAP were collected, and longitudinal sections were prepared such that both endosperm and embryo were included. Tissue sections were stained with Safranin O and fast green. Bars apply to both images in each row.
Figure 8.
Figure 8.
Amylopectin Chain Length Distribution. Total starch from the indicated genotypes was debranched with commericial isoamylase, and mole percentage of linear chains of each degree of polymerization was normalized to the total number of chains from DP5 to DP48. Plots show the difference between the mole percentage of each chain length for the two indicated lines. The designations #1, #2, etc., indicate independent biological replicates of the same genotype. For comparison between genotypes (bottom row), the average values for four independent replicates of the mutant and two independent replicates of each wild-type inbred line were compared. [See online article for color version of this figure.]
Figure 9.
Figure 9.
Starch Modifying Enzymes. Extracts of 20 DAP endosperm were separated by native-PAGE and analyzed by zymogram. Differential color staining in I2/KI revealed changes in starch structure owing to specific enzyme activities. Blue bands result from ISA complexes and red bands from starch branching enzymes. ISA form I is known to be an ISA1 homomeric complex, whereas forms II and III are ISA1/ISA2 heteromers. The asterisk indicates the position of an ISA activity observed reproducibly in o5-Ref endosperm that is not seen in the wild type.
Figure 10.
Figure 10.
Effects of o5- Mutations on Leaf and Chloroplast Morphology. Seedling leaves were fixed and sectioned for either light microscopy or TEM. The top row shows chloroplasts as dark staining bodies that appear contiguous in the bundle sheath cells. Individual mesophyll chloroplasts visualized by TEM are shown in the bottom two rows. Bars apply uniformly within each row. WT, wild type.

Similar articles

Cited by

References

    1. Andorf C.M., Lawrence C.J., Harper L.C., Schaeffer M.L., Campbell D.A., Sen T.Z. (2010). The Locus Lookup tool at MaizeGDB: Identification of genomic regions in maize by integrating sequence information with physical and genetic maps. Bioinformatics 26: 434–436 - PubMed
    1. Awai K., Maréchal E., Block M.A., Brun D., Masuda T., Shimada H., Takamiya K., Ohta H., Joyard J. (2001). Two types of MGDG synthase genes, found widely in both 16:3 and 18:3 plants, differentially mediate galactolipid syntheses in photosynthetic and nonphotosynthetic tissues in Arabidopsis thaliana. Proc. Natl. Acad. Sci. USA 98: 10960–10965 - PMC - PubMed
    1. Badenhuizen N.P. (1969). The Biogenesis of Starch Granules in Higher Plants. (New York: Appleton-Century-Crofts; ).
    1. Ball S.G., Morell M.K. (2003). From bacterial glycogen to starch: Understanding the biogenesis of the plant starch granule. Annu. Rev. Plant Biol. 54: 207–233 - PubMed
    1. Barkan A., Martienssen R.A. (1991). Inactivation of maize transposon Mu suppresses a mutant phenotype by activating an outward-reading promoter near the end of Mu1. Proc. Natl. Acad. Sci. USA 88: 3502–3506 - PMC - PubMed

MeSH terms

LinkOut - more resources