Review
. 2011 Jun 15;25(12):1205-31.
doi: 10.1101/gad.2050011.

Biological mechanisms, one molecule at a time

Affiliations
Review

Biological mechanisms, one molecule at a time

Ignacio Tinoco Jr et al. Genes Dev. .

Abstract

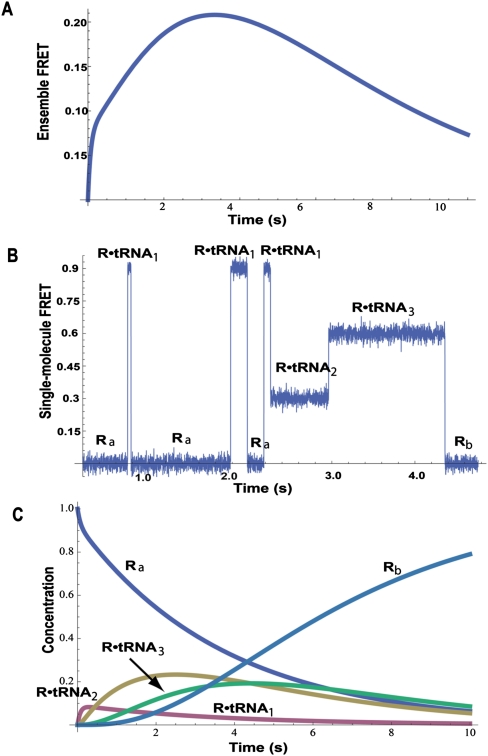
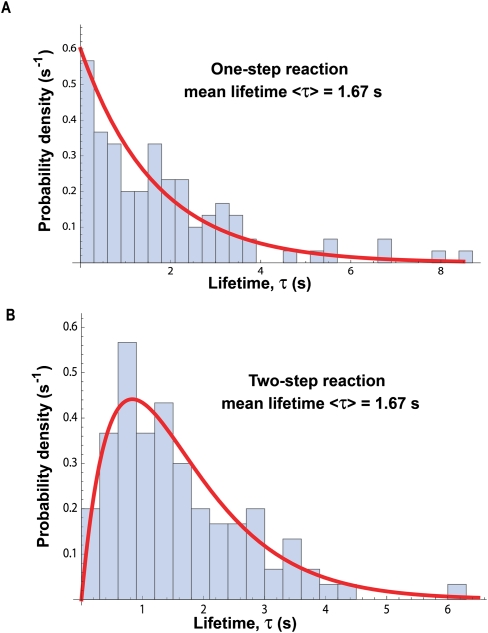
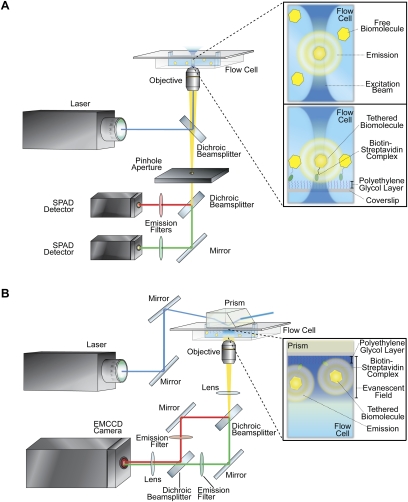
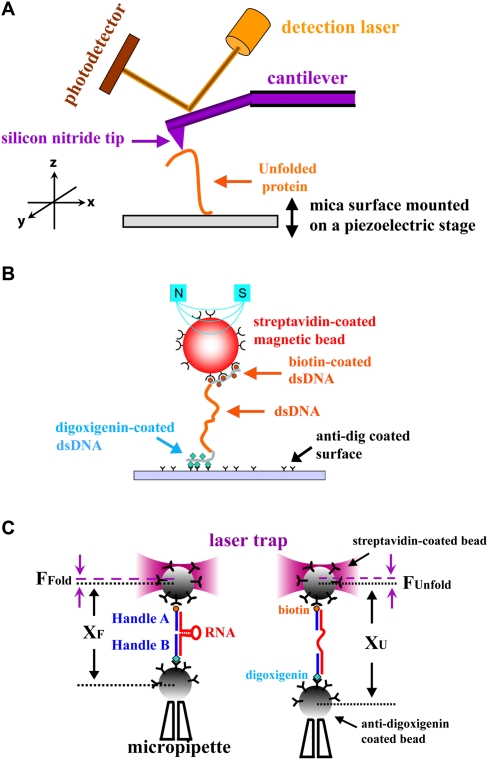
The last 15 years have witnessed the development of tools that allow the observation and manipulation of single molecules. The rapidly expanding application of these technologies for investigating biological systems of ever-increasing complexity is revolutionizing our ability to probe the mechanisms of biological reactions. Here, we compare the mechanistic information available from single-molecule experiments with the information typically obtained from ensemble studies and show how these two experimental approaches interface with each other. We next present a basic overview of the toolkit for observing and manipulating biology one molecule at a time. We close by presenting a case study demonstrating the impact that single-molecule approaches have had on our understanding of one of life's most fundamental biochemical reactions: the translation of a messenger RNA into its encoded protein by the ribosome.


Figures

Figure 1.
Figure 1.
Comparison of ensemble measurements with single-molecule measurements. (A) The calculated ensemble FRET versus time for a reaction that has three intermediates with different FRET values. The ensemble measurement does not give a hint about the number of intermediates. (B) A simulated smFRET for the reaction showing the three different species with FRET values of 0.9, 0.6, and 0.3. The single-molecule measurement reveals the step-by-step movement from reactant to each intermediate to product. (C) The calculated concentration of each species versus time for the reaction. Note that reactants, products, and intermediates are all present throughout the reaction.
Figure 2.
Figure 2.
The distribution of lifetimes measured in single-molecule experiments. (A) A distribution of 100 lifetimes expected for a single reaction with rate constant k = 0.60 sec−1. The distribution is exponential with a mean lifetime <τ> = 1/k = 1.67 sec. Note that a measured lifetime can vary from 0.1 sec to 8 sec, in principle from zero to infinity. (B) A distribution of 100 lifetimes expected for two successive reactions, which produce the new species; each rate constant k = 1.20 sec−1. The distribution is no longer exponential, but its mean lifetime <τ> = 2/k = 1.67 sec.
Figure 3.
Figure 3.
A plot of the FRET efficiency (EFRET) as a function of the distance (R) between a donor fluorophore (green sphere) and an acceptor fluorophore (red sphere) with an R0 of 55 Å. When R <R0, EFRET > 0.50; when R = R0, EFRET = 0.50; and when R > R0, EFRET < 0.50 (adapted with permission from Macmillan Publishers Ltd., © 2008, from Roy et al. [2008]).
Figure 4.
Figure 4.
Optical setups for single-molecule detection studies. (A) A typical confocal fluorescence microscope for single-molecule fluorescence imaging. The insets show enlarged views of a single, fluorescently labeled biomolecule either diffusing freely through the excitation focal volume (top inset) or tethered to the surface within the excitation focal volume (bottom inset). (B) A typical, prism-based TIRF microscope for single-molecule fluorescence imaging. The inset shows an enlarged view of a surface-tethered, fluorescently labeled biomolecule within the evanescent field produced at the interface between the quartz surface and the aqueous solution.
Figure 5.
Figure 5.
Experimental devices for single-molecule mechanical studies. (A) AFM. (B) Magnetic tweezers. (C) Laser or optical tweezers. From Figure 1 in from Tinoco et al. (2006) (© 2006 Cambridge University Press), used with permission.
Figure 6.
Figure 6.
Force–extension curves showing rips as a protein or an RNA unfolds. (A) Force–extension curves for the unfolding of RNA domains from the Tetrahymena thermophila ribozyme. P5ab is a hairpin that unfolds reversibly, showing superimposed unfolding and folding trajectories. P5abc has a three-helix junction that unfolds irreversibly; there is hysterisis between the unfolding and folding curves. Data are from Tinoco (2004). (B) A force–extension curve obtained with an AFM of a recombinant protein composed of the I27–I34 region of the I band of human cardiac titin. Linking several domains together gives the characteristic sawtooth pattern as each domain unfolds. Data are from Li et al. (2000); © 2000 Proceedings National Academy of Sciences. (C) The hopping at constant force of a hairpin from the TAR region of HIV RNA. As the molecule transits from a folded double strand to an unfolded single strand, the end-to-end distance changes by 18 nm. Data are from Li et al. (2006).
Figure 7.
Figure 7.
(A) Structure of the ribosome. The 30S and 50S subunits are shown in tan and light blue. The L1 protein and 23S ribosomal RNA that comprise the L1 stalk are shown in dark blue and blue. The E, P, and A site tRNAs are depicted in purple, red, and orange. The fragment of mRNA containing the E, P, and A site codons is shown in gray. (B) The translation elongation cycle. The main steps of the translation elongation cycle—aa-tRNA selection, peptide bond formation, and translocation—are shown. The 30S subunit is in tan, and the 50S subunit is light blue. The mRNA is shown as a gray curve running along the 30S subunit, and the E, P, and A tRNA-binding sites are denoted in black circles below the corresponding sites on the 30S subunits. tRNAs are shown in red, and the nascent polypeptide is shown as a string of gray spheres. EF-Tu and EF-G are shown in light green.
Figure 8.
Figure 8.
The kinetic mechanism of aa-tRNA selection. The ribosome, tRNAs, mRNA, and EF-Tu are depicted as in Figure 7.
Figure 9.
Figure 9.
Pre-steady-state EFRET versus time trajectories obtained using TIRF microscopy of INI complexes undergoing aa-tRNA selection under various experimental conditions. (Top row) Structural models of the final state achieved under each experimental condition are displayed as in Figure 8. The approximate positions of the donor and acceptor fluorophores corresponding are shown as green and red spheres, respectively. (Middle row) Representative donor and acceptor emission intensities versus time trajectories are shown in green and red, respectively. (Bottom row) The corresponding EFRET versus time trajectories, calculated using EFRET = IA/(IA + ID), where IA and ID are the emission intensities of the acceptor and the donor, respectively, are shown in blue. (A) Delivery of a cognate aa-tRNA. (B) Delivery of a near-cognate aa-tRNA. (C) Delivery of a cognate aa-tRNA in the presence of GDPNP. (D) Delivery of a cognate aa-tRNA in the presence of GTP and kirromycin (adapted with permission from Macmillan Publishers Ltd., © 2004, from Blanchard et al. 2004a).
Figure 10.
Figure 10.
The kinetic mechanism of translocation. The ribosome, mRNA, and EF-G are depicted as in Figure 7. In this figure, the newly deacylated P site tRNA that will be translocated into the E site and the newly formed A site peptidyl-tRNA at the A site that will be translocated into the P site are shown in red and orange, respectively. The L1 stalk of the 50S subunit and the head domain of the 30S subunit are shown in dark outlines on their respective subunits. The role that swiveling of the 30S subunit's head domain (denoted by the curved arrow superimposed onto the head domain) plays in translocation has been elucidated recently by cryo-EM (Ratje et al. 2010).
Figure 11.
Figure 11.
Steady-state EFRET versus time trajectories obtained using TIRF microscopy of PRE complexes undergoing thermally activated fluctuations between GS1 and GS2. (Top row) Structural models of GS1 and GS2 are displayed as in Figure 10. The approximate positions of the donor and acceptor fluorophores corresponding to each donor–acceptor labeling scheme are shown as green and red spheres, respectively. (Middle row) Representative donor and acceptor emission intensities versus time trajectories are shown in green and red, respectively. (Bottom row) The corresponding EFRET versus time trajectories, calculated using EFRET = IA/(IA + ID), where IA and ID are the emission intensities of the acceptor and the donor, respectively, are shown in blue. (A) The tRNA–tRNA smFRET signal fluctuates between 0.74 (classical tRNA configuration, GS1) and 0.45 (hybrid tRNA configuration, GS2) values of EFRET (adapted from Blanchard et al. [2004b] with permission from The National Academy of Sciences, © 2004). (B) The L1–L9 smFRET signal fluctuates between 0.56 (open L1 stalk conformation, GS1) and 0.34 (closed L1 stalk conformation, GS2) values of EFRET (reprinted from Fei et al. [2009] with permission from The National Academy of Sciences, USA). (C) The L1-tRNA smFRET signal fluctuates between 0.21 (open L1 stalk not interacting with P/P-configured tRNA, GS1) and 0.84 (closed L1 stalk interacting with P/E-configured tRNA, GS2) values of EFRET (reprinted from Fei et al. [2008] with permission from Elsevier, © 2008). (D) The S6-L9 intersubunit smFRET signal fluctuates between 0.56 (nonrotated subunit orientation, GS1) and 0.40 (rotated subunit orientation, GS2) values of EFRET (adapted from Cornish et al. [2008] with permission from Elsevier, © 2008).
Figure 12.
Figure 12.
Experimental arrangement and mRNAs used to study single-molecule translation. (A) A hairpin mRNA is held between two micron-sized beads. A ribosome is stalled on the mRNA; addition of missing amino acids restarts translation. (B) The mRNAs consist of Val and Glu codons and have RNA•DNA handles to attach them to the beads. The figure is modified from Figure 1 in Wen et al. (2008), and is used with permission.
Figure 13.
Figure 13.
Single-molecule translation. (A) A trajectory showing repeating steps as an mRNA is translated while held at constant force of 20 pN. (B) The increase at each step is equal to 2.7 nm, as shown by the pairwise distribution of distances. Three base pairs converted to six single-stranded nucleotides (translation of one codon) gives an increase in extension of 2.7 nm. The figure is modified from Figure 2 in Wen et al. (2008), and is used with permission.

References

    1. Abelson J, Blanco M, Ditzler MA, Fuller F, Aravamudhan P, Wood M, Villa T, Ryan DE, Pleiss JA, Maeder C, et al. 2010. Conformational dynamics of single pre-mRNA molecules during in vitro splicing. Nat Struct Mol Biol 17: 504–512 - PMC - PubMed
    1. Aitken CE, Puglisi JD 2010. Following the intersubunit conformation of the ribosome during translation in real time. Nat Struct Mol Biol 17: 793–800 - PMC - PubMed
    1. Aitken CE, Marshall RA, Puglisi JD 2008. An oxygen scavenging system for improvement of dye stability in single-molecule fluorescence experiments. Biophys J 94: 1826–1835 - PMC - PubMed
    1. Aitken CE, Petrov A, Puglisi JD 2010. Single ribosome dynamics and the mechanism of translation. Annu Rev Biophys 39: 491–513 - PubMed
    1. Ashkin A 1970. Acceleration and trapping of particles by radiation pressure. Phys Rev Lett 24: 156–159

Publication types

LinkOut - more resources