. 2011 Oct;108(6):1097-109.
doi: 10.1093/aob/mcr125. Epub 2011 Jun 17.

NEMA, a functional-structural model of nitrogen economy within wheat culms after flowering. II. Evaluation and sensitivity analysis

Affiliations

NEMA, a functional-structural model of nitrogen economy within wheat culms after flowering. II. Evaluation and sensitivity analysis

Jessica Bertheloot et al. Ann Bot. 2011 Oct.

Abstract

Background and aims: Simulating nitrogen economy in crop plants requires formalizing the interactions between soil nitrogen availability, root nitrogen acquisition, distribution between vegetative organs and remobilization towards grains. This study evaluates and analyses the functional-structural and mechanistic model of nitrogen economy, NEMA (Nitrogen Economy Model within plant Architecture), developed for winter wheat (Triticum aestivum) after flowering.

Methods: NEMA was calibrated for field plants under three nitrogen fertilization treatments at flowering. Model behaviour was investigated and sensitivity to parameter values was analysed.

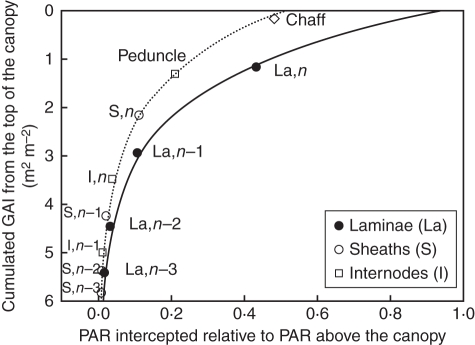
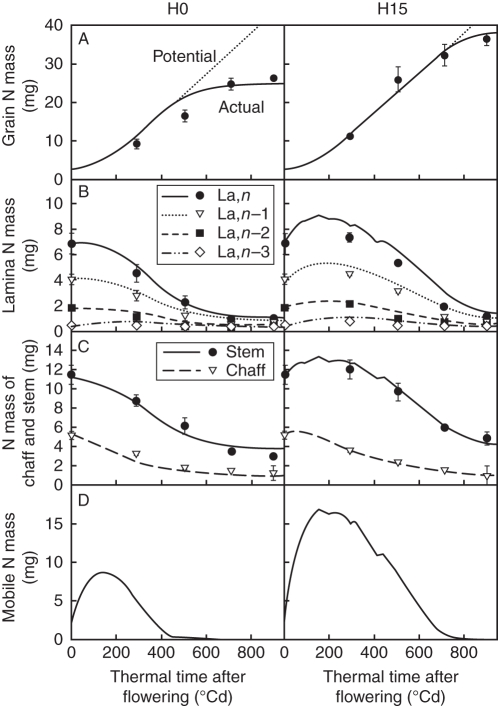
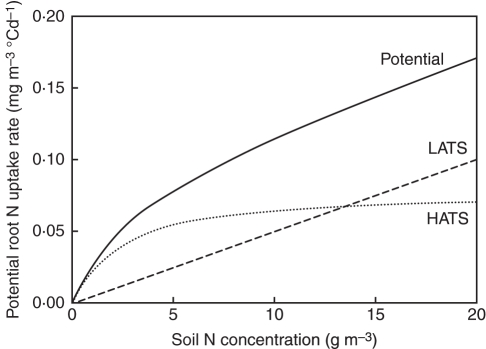
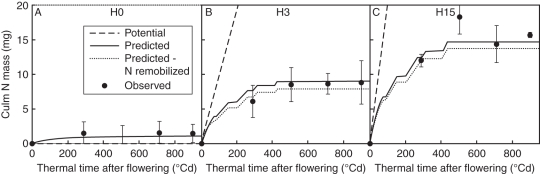
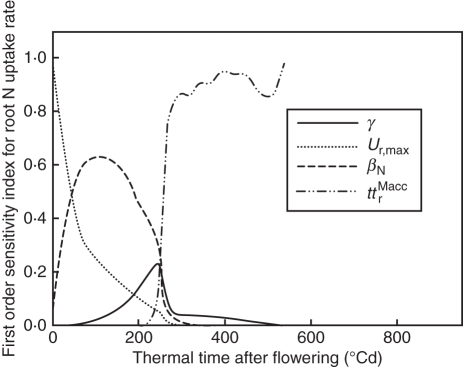
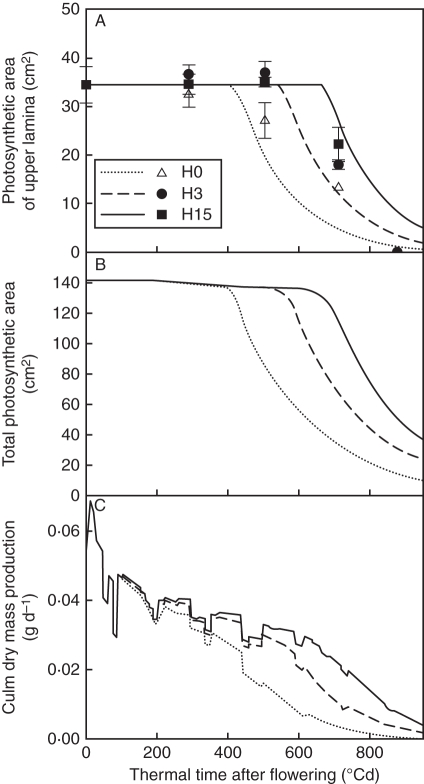
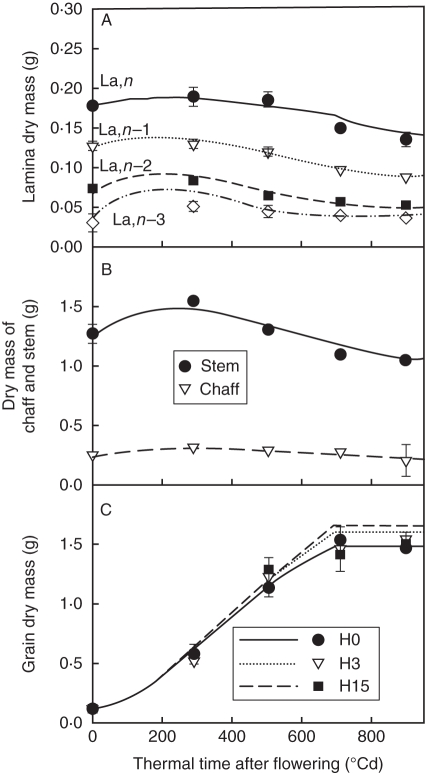
Key results: Nitrogen content of all photosynthetic organs and in particular nitrogen vertical distribution along the stem and remobilization patterns in response to fertilization were simulated accurately by the model, from Rubisco turnover modulated by light intercepted by the organ and a mobile nitrogen pool. This pool proved to be a reliable indicator of plant nitrogen status, allowing efficient regulation of nitrogen acquisition by roots, remobilization from vegetative organs and accumulation in grains in response to nitrogen treatments. In our simulations, root capacity to import carbon, rather than carbon availability, limited nitrogen acquisition and ultimately nitrogen accumulation in grains, while Rubisco turnover intensity mostly affected dry matter accumulation in grains.

Conclusions: NEMA enabled interpretation of several key patterns usually observed in field conditions and the identification of plausible processes limiting for grain yield, protein content and root nitrogen acquisition that could be targets for plant breeding; however, further understanding requires more mechanistic formalization of carbon metabolism. Its strong physiological basis and its realistic behaviour support its use to gain insights into nitrogen economy after flowering.


Figures

Fig. 1.
Fig. 1.
Calculated green area index (GAI) cumulated from the canopy top vs. the predicted PAR (J m−2 d−1) intercepted by entities at flowering, expressed relative to PAR above the canopy for each type of entity. The solid line represents laminae, the dotted line vertical entities. Symbols represent values for each entity, calculated for the middle exposed height of the entity. Laminae are denoted by La, sheaths by S and internodes by I, numbered according to their rank from the top (n being the flag leaf).
Fig. 2.
Fig. 2.
Observed (symbols) and predicted (lines) time courses of N mass for (A) grains, (B) individual laminae, (C) chaff and stem (i.e. internodes, sheaths and peduncle pooled), (D) and the common pool for treatments H0 and H15. For grains, the potential function of N mass accumulation is represented by dotted lines. Laminae are denoted La and numbered according to their rank from the top (n being the flag leaf). The observed data are means of three independent replicates. The vertical bars represent ± s.d.
Fig. 3.
Fig. 3.
SRC index defining sensitivity of grain N mass to model parameters in treatment H1 vs. thermal time after flowering. Only parameters that had an SRC index >0·1 at least once are represented. γ (°Cd−1) is the relative rate of potential grain N filling during cell division; ttrMacc (°Cd) is the period during which roots can accumulate dry mass.
Fig. 4.
Fig. 4.
Potential root N uptake rate as a function of N concentration available in the soil; the contributions of high and low affinity transport systems (HATS and LATS, respectively) are indicated.
Fig. 5.
Fig. 5.
Potential, observed and predicted time courses of N mass in the aerial part of the culm, and simulated time courses of the cumulated N mass taken up by roots (dotted lines) in treatments H0, H3 and H15 (expt 1) during the post-flowering period. The cumulated N mass taken up by roots during the post-flowering period was calculated as the difference between N mass in the aerial parts of the culm and the cumulated N mass remobilized by roots. The observed data are means of three independent replicates. The vertical bars represent ± s.d.
Fig. 6.
Fig. 6.
First order sensitivity indices (Sobol's method) defining the sensitivity of the root N uptake rate to model parameters in treatment H1 vs. thermal time after flowering. Only parameters that had indices >0·1 at least once are represented. γ (°Cd−1) is the relative rate of potential grain N filling during cell division; Ur,max (g m−3 °Cd−1) is the theoretical maximum N acquisition at saturating soil N concentration; βN (dimensionless) is the coefficient for N availability effect on root N uptake; ttrMacc (°Cd) is the period during which roots can accumulate dry mass.
Fig. 7.
Fig. 7.
Time courses of observed (symbols) and predicted (lines) photosynthetic area of the upper lamina (A), predicted culm photosynthetic area (B) and dry mass production at the culm scale (C) for the three N treatments H0, H3 and H15. The observed data are means of three independent replicates. The vertical bars represent ± s.d.
Fig. 8.
Fig. 8.
Observed (symbols) and predicted (lines) time courses of dry mass for (A) individual laminae, (B) chaff and stem (i.e. internodes, sheaths and peduncle pooled) and (C) grains. For laminae, stem and chaff, mean values of all treatments are represented; for grains, dry mass is represented for each treatment, H0, H3 and H15. The observed data are means of nine (A, B) or three (C) independent replicates. The vertical bars represent ± s.d.
Fig. 9.
Fig. 9.
SRC index defining the sensitivity of grain dry mass to model parameters for treatment H1 vs. thermal time after flowering. Only parameters that had an SRC index >0·1 at least once are represented. αgrain and βgrain (dimensionless) determine the shape of the beta function indicating the pattern of change in sink strength for dry mass during grains' life; σgrainM (dimensionless) is grains' relative sink strength; ttgrainMacc (°Cd) is the period during which grains can accumulate dry mass; δlaN (°Cd−1) is the relative degradation rate of remobilizable N for laminae; ωla (d−1) is the proportion coefficient linking photosynthesis at saturating PAR and N mass per unit photosynthetic area for laminae.

References

    1. Bancal P. Decorrelating source and sink determinism of nitrogen remobilization during grain filling in wheat. Annals of Botany. 2009;103:1315–1324. - PMC - PubMed
    1. Barneix AJ. Physiology and biochemistry of source-regulated protein accumulation in the wheat grain. Journal of Plant Physiology. 2007;164:581–590. - PubMed
    1. Bertheloot J, Andrieu B, Fournier C, Martre P. A process-based model to simulate nitrogen distribution in wheat (Triticum aestivum) during grain-filling. Functional Plant Biology. 2008a;35:781–796. - PubMed
    1. Bertheloot J, Martre P, Andrieu B. Dynamics of light and nitrogen distribution during grain filling within wheat canopy. Plant Physiology. 2008b;148:1707–1720. - PMC - PubMed
    1. Bertheloot J, Cournède P-H, Andrieu B. Nitrogen acquisition and utilization by crops: review of different approaches and proposition of a mechanistic modeling. In: Li B, Jaeger M, Guo Y., editors. PMA09: the Third International Symposium on Plant Growth Modeling, Simulation, Visualization and Applications. Beijing, China: IEEE; 2010.

Publication types

MeSH terms