

NEMA, a functional-structural model of nitrogen economy within wheat culms after flowering. I. Model description
- PMID: 21685431
- PMCID: PMC3189836
- DOI: 10.1093/aob/mcr119
NEMA, a functional-structural model of nitrogen economy within wheat culms after flowering. I. Model description
Abstract
Background and aims: Models simulating nitrogen use by plants are potentially efficient tools to optimize the use of fertilizers in agriculture. Most crop models assume that a target nitrogen concentration can be defined for plant tissues and formalize a demand for nitrogen, depending on the difference between the target and actual nitrogen concentrations. However, the teleonomic nature of the approach has been criticized. This paper proposes a mechanistic model of nitrogen economy, NEMA (Nitrogen Economy Model within plant Architecture), which links nitrogen fluxes to nitrogen concentration and physiological processes.
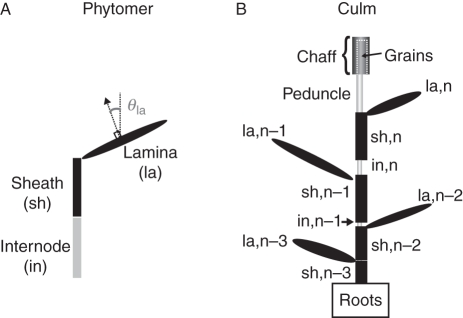
Methods: A functional-structural approach is used: plant aerial parts are described in a botanically realistic way and physiological processes are expressed at the scale of each aerial organ or root compartment as a function of local conditions (light and resources).
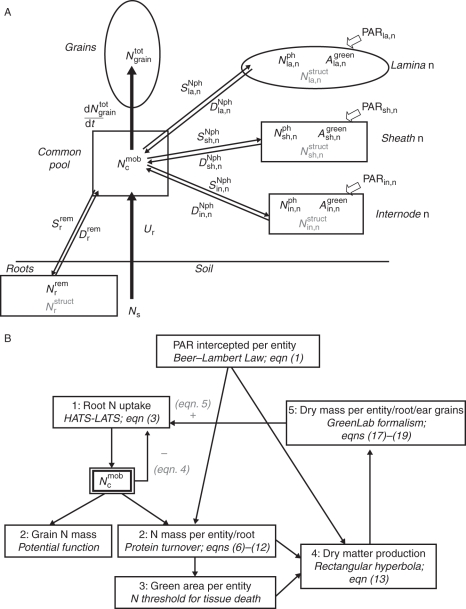
Key results: NEMA was developed for winter wheat (Triticum aestivum) after flowering. The model simulates the nitrogen (N) content of each photosynthetic organ as regulated by Rubisco turnover, which depends on intercepted light and a mobile N pool shared by all organs. This pool is enriched by N acquisition from the soil and N release from vegetative organs, and is depleted by grain uptake and protein synthesis in vegetative organs; NEMA accounts for the negative feedback from circulating N on N acquisition from the soil, which is supposed to follow the activities of nitrate transport systems. Organ N content and intercepted light determine dry matter production via photosynthesis, which is distributed between organs according to a demand-driven approach.
Conclusions: NEMA integrates the main feedbacks known to regulate plant N economy. Other novel features are the simulation of N for all photosynthetic tissues and the use of an explicit description of the plant that allows how the local environment of tissues regulates their N content to be taken into account. We believe this represents an appropriate frame for modelling nitrogen in functional-structural plant models. A companion paper will present model evaluation and analysis.
Figures
References
-
- Ackerly D. Self-shading, carbon gain and leaf dynamics: a test of alternative optimality models. Oecologia. 1999;119:300–310. - PubMed
-
- Ackerly DD, Bazzaz FA. Leaf dynamics, self-shading and carbon gain in seedlings of a tropical pioneer tree. Oecologia. 1995;101:289–298. - PubMed
-
- Allen MT, Prusinkiewicz P, DeJong TM. Using L-systems for modeling source–sink interactions, architecture and physiology of growing trees: the L-PEACH model. New Phytologist. 2005;166:869–880. - PubMed
-
- Aloni R, Langhans M, Aloni E, Dreieicher E, Ullrich CI. Root-synthesized cytokinin in Arabidopsis is distributed in the shoot by the transpiration stream. Journal of Experimental Botany. 2005;56:1535–1544. - PubMed
