. 2011 Jun 19;13(7):762-70.
doi: 10.1038/ncb2283.

Opposing effects of Tcf3 and Tcf1 control Wnt stimulation of embryonic stem cell self-renewal

Affiliations

Opposing effects of Tcf3 and Tcf1 control Wnt stimulation of embryonic stem cell self-renewal

Fei Yi et al. Nat Cell Biol. .

Abstract

The co-occupancy of Tcf3 with Oct4, Sox2 and Nanog on embryonic stem cell (ESC) chromatin indicated that Tcf3 has been suggested to play an integral role in a poorly understood mechanism underlying Wnt-dependent stimulation of mouse ESC self-renewal of mouse ESCs. Although the conventional view of Tcf proteins as the β-catenin-binding effectors of Wnt signalling suggested Tcf3-β-catenin activation of target genes would stimulate self-renewal, here we show that an antagonistic relationship between Wnt3a and Tcf3 on gene expression regulates ESC self-renewal. Genetic ablation of Tcf3 replaced the requirement for exogenous Wnt3a or GSK3 inhibition for ESC self-renewal, demonstrating that inhibition of Tcf3 repressor is the necessary downstream effect of Wnt signalling. Interestingly, both Tcf3-β-catenin and Tcf1-β-catenin interactions contributed to Wnt stimulation of self-renewal and gene expression, and the combination of Tcf3 and Tcf1 recruited Wnt-stabilized β-catenin to Oct4 binding sites on ESC chromatin. This work elucidates the molecular link between the effects of Wnt and the regulation of the Oct4/Sox2/Nanog network.


Figures
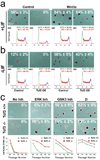
Figure 1
Figure 1. Tcf3 regulates the Wnt stimulation and GSK3-inhibition of ES cell self renewal
(a–b) Alkaline phosphatase (AP) staining of ES cell colonies after four days in control or Wnt3a conditioned media (indicated at top). Overexpression of full-length Tcf3 protein (indicated at bottom) was induced at the onset of the experiment. Supplementary Fig. S2 shows Western blot analysis of protein lysates taken from Tcf3-overexpressing cells. The percentage of AP+ ES colonies (yellow number atop each image) represents mean ± standard deviation of biological duplicated experiments. Below each image, flow cytometry analysis of cell cycle progression by propidium iodide staining was performed on separate cell cultures subjected to the same conditions for three days. Results shown in (a) were performed in media containing 1000 U/ml of exogenous LIF, whereas those shown in (b) did not contain exogenous LIF. (c) ES colony formation from Tcf3+/+ or Tcf3+/+ cells (indicated on left) subjected to serum-free culture conditions for four days and stained for AP activity. Colonies were treated with N2B27 media without inhibitors (No Inh), N2B27 media + PD0325901 (ERK Inh), N2B27 media + CHIR99021 (GSK3 Inh), or N2B27 + PD0325901 and CHIR99021 (2i). The percentage of AP+ ES colonies (yellow number atop each image) represents mean ± standard deviation of biological duplicated experiments. (d) Number of dye-excluding cells following each serial passage of Tcf3+/+ (green) and Tcf3−/− (red) ES cells in serum free conditions as noted in (c).
Figure 2
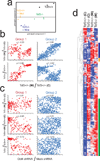
Figure 2. Wnt3a stimulates and Tcf3 inhibits expression of Oct4 and Nanog regulated genes
(a) Principle component analysis of gene expression in four conditions in ES cells: Tcf3+/+ (black); Tcf3−/− (green); Tcf3+/+ +Wnt3a (orange); Tcf3−/− +Wnt3a (blue). Each point represents one of three biological replicates for each condition. (b) Each point on a graph represents one of the 831 genes significantly increased in any of the three comparisons (Tcf3−/− vs. Tcf3+/+; Tcf3+/+ +Wnt3a vs. Tcf3+/+; or Tcf3−/− +Wnt3a vs. Tcf3−/−). Individual genes are listed in Supplementary Table S1. Genes were separated into group 1 (red) and group 2 (blue) genes and plotted according to their rank fold effect in the comparisons listed on each axis. Pearson correlation coefficients (top of each graph) are shown for each comparison. Calculations for formation of groups and determination of correlation coefficients are presented inSupplementary Table S2. (c) Individual genes were plotted based on rank fold effect of Oct4 shRNA treatment (x-axis) and the effect of Tcf3 and/or Wnt3a (y-axis). Group 1 or group 2 genes are the same as in (b). Pearson correlation coefficients (top of each graph) are shown for each comparison. Calculations for formation of groups and determination of correlation coefficients are presented in Supplementary Table S2. (d) Hierarchical clustering comparison of effects caused by ablation of Tcf3 and Wnt3a treatment. The heat map shows only genes that were decreased by Oct4 and Nanog RNAi experiments . Genes that were increased in Tcf3−/− and further increased in Tcf3−/− +Wnt3a are highlighted with the green bar. Genes that were increased by Wnt3a in a partially Tcf3-dependent manner are highlighted with blue and orange bar. Expression values for the 311 genes are presented in Supplementary Table S3
Figure 3
Figure 3. Nanog-independence of Wnt3a/Tcf3-mediated effects on gene expression
(a) Tcf3+/+ ES cells were transfected with Nanog siRNA or control (SCRM) siRNA and treated for 24hr with 50 ng/ml Wnt3a. Protein lysates were used for Western blot analysis to detect Nanog and Tubulin proteins. Identically treated cells were used for RNA isolation for qPCR data shown in Fig 3d. (b) Tcf3−/− ES cells were stably transfected with either a Nanog shRNA or control pSuper vector. Protein lysates were used for Western blot analysis to detect Nanog and Tubulin proteins. Identically treated cells were used for RNA isolation for qPCR data shown in Fig 3d. (c) Tcf3+/+ ES cells were stably transfected with a Nanog-overexpression plasmid. Protein lysates from cells grown in LIF+, self renewal conditions were used for Western blot analysis to detect Nanog and Tubulin proteins. Tcf3+/+ and Tcf3−/− without the Nanog expression plasmid were included as controls. Identically treated cells were used for RNA isolation for qPCR data shown in Fig 3d. (d) Quantitative PCR analysis measuring mRNA levels of 10 group 1 genes (Fig 2). The level of each gene (rows) relative to GAPDH was used to determine fold change effects shown in the heatmap. Raw data are shown in Supplementary Table S4. Fold changes are shown for each the comparisons depicted atop each column, and numbers within each box equal fold-changes for each gene. Note that for most genes, knockdown of Nanog did not reduce the stimulation of gene expression caused by Wnt3a treatment or by Tcf3 ablation. In addition, overexpression of Nanog in Tcf3+/+ cells was not sufficient to activate expression of group 1 genes as well as either Wnt3a treatment or Tcf3 ablation.
Figure 4
Figure 4. A combination of Tcf3-β-catenin-dependent and Tcf3-β-catenin-independent mechanisms mediate Wnt3a stimulation of self renewal and target gene expression
(a) Alkaline phosphatase staining of Tcf3+/+, Tcf3−/− and Tcf3ΔN/ΔN ES colonies after four days in serum containing media without LIF, and without (Control; left) or with 50 ng/ml recombinant mouse Wnt3a (Wnt3a; right). The percentage of AP+ ES colonies (white number atop each image) represents mean ± standard deviation of biological duplicate experiments. (b) Luciferase reporter assays for β-catenin stimulation of SuperTOPFlash (top graph), Nanog promoter (middle graph) and Nr5a2 promoter (bottom graph). Increasing amount of stable ΔNβ-catenin expression plasmid differentially activated reporter activities in Tcf3+/+ (white), Tcf3−/−(black) and Tcf3ΔN/ΔN (gray) ES cells. Data supporting the generation and primary characterization of Tcf3ΔN/ΔN ES cells are shown in Supplementary Fig. S4. Values represent mean ± standard deviation of biological duplicates.
Figure 5
Figure 5. Endogenous Tcf1 stimulates Tcf3-β-catenin-independent activation of Wnt target genes
(a) Tcf cDNAs were measured by qPCR from RNA isolated from Tcf3+/+, Tcf3−/− and Tcf3ΔN/ΔN ES cells. (b) Stable ΔNβ-catenin expression plasmid was cotransfected into ES cells with increasing concentrations of the indicated Tcf-expression plasmids. Relative SuperTOPFlash luciferase levels were measured and values represent mean of biological duplicates +/− standard deviation. (c) qPCR measurement of Tcf1 mRNA (graph) from Tcf1 shRNA and SCRM shRNA cell lines identified at the bottom of the panel. Western blot analysis of protein lysates isolated from indicated ES cell lines was performed using antibodies identified at the right. Data supporting the effectiveness of shRNA knockdown of Tcf1 are shown in Supplementary Fig. S5. (d) SuperTOPFlash luciferase reporter assay using cell lines also used in (c) for transfection of increasing levels of stable ΔNβ-catenin expression plasmid.
Figure 6
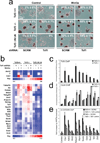
Figure 6. Combined effect of Tcf1 and Tcf3-β-catenin for the Wnt3a response of ES cells
(a) Alkaline phosphatase staining of colonies from ES cell lines with different Tcf3 genotypes (indicated on left) and expressing an shRNA (indicated on bottom). Colonies were formed for four days in serum containing media without LIF, and with control or Wnt3a (indicated on top). Percentage of AP+ colonies (white number) represents mean ± standard deviation of biological duplicates. Wnt3a stimulated self-renewal at different levels in Tcf3+/+, Tcf3−/− and Tcf3ΔN/ΔN ES cells, while knockdown of Tcf1 significantly reduced stimulations in all three ES cell lines. (b) Gene expression analysis in different Tcf3 ES cell lines ± Tcf1 shRNA and ± recombinant Wnt3a. The relative level of mRNA for each gene is compared to untreated Tcf3+/+ cells set at 1.0. Numerical values +/− standard deviations are shown in Supplementary Table S5. (c–e) Chromatin immunoprecipitated with antibodies against Tcf3 (c), Oct4 (d), or β-catenin (e) was measured by qPCR using primers (Supplementary Table S5) specific for upstream regions of the ten genes labeled at the bottom of graph shown in (e). A representative graph from three biological replicates is shown for each experiment. (c,d) Assays were performed using chromatin from Tcf3+/+ (black) and Tcf3−/− (gray) ES cells. Values represent the mean percentage of DNA immunoprecipitated relative to input ± standard deviations of replicate measurements. (e) Assays were performed using chromatin from Tcf3 ES cell lines ± Tcf1 shRNA and ± Wnt3a conditioned media. The percentage of β-catenin immunoprecipitated was determined for control and +Wnt3a treatments, and values represent the mean fold increase in β-catenin occupancy stimulated by Wnt3a ± standard deviations of replicate measurements.

Comment in

References

    1. Kim J, Chu J, Shen X, Wang J, Orkin SH. An extended transcriptional network for pluripotency of embryonic stem cells. Cell. 2008;132:1049–1061. - PMC - PubMed
    1. Liang J, et al. Nanog and Oct4 associate with unique transcriptional repression complexes in embryonic stem cells. Nat Cell Biol. 2008;10:731–739. - PubMed
    1. Boyer LA, et al. Core transcriptional regulatory circuitry in human embryonic stem cells. Cell. 2005;122:947–956. - PMC - PubMed
    1. Loh YH, et al. The Oct4 and Nanog transcription network regulates pluripotency in mouse embryonic stem cells. Nat Genet. 2006 - PubMed
    1. Nichols J, et al. Formation of pluripotent stem cells in the mammalian embryo depends on the POU transcription factor Oct4. Cell. 1998;95:379–391. - PubMed

Publication types

MeSH terms

Associated data