. 2011 Jun 19;29(7):625-34.
doi: 10.1038/nbt.1900.

A targeted proteomics-based pipeline for verification of biomarkers in plasma

Affiliations

A targeted proteomics-based pipeline for verification of biomarkers in plasma

Jeffrey R Whiteaker et al. Nat Biotechnol. .

Abstract

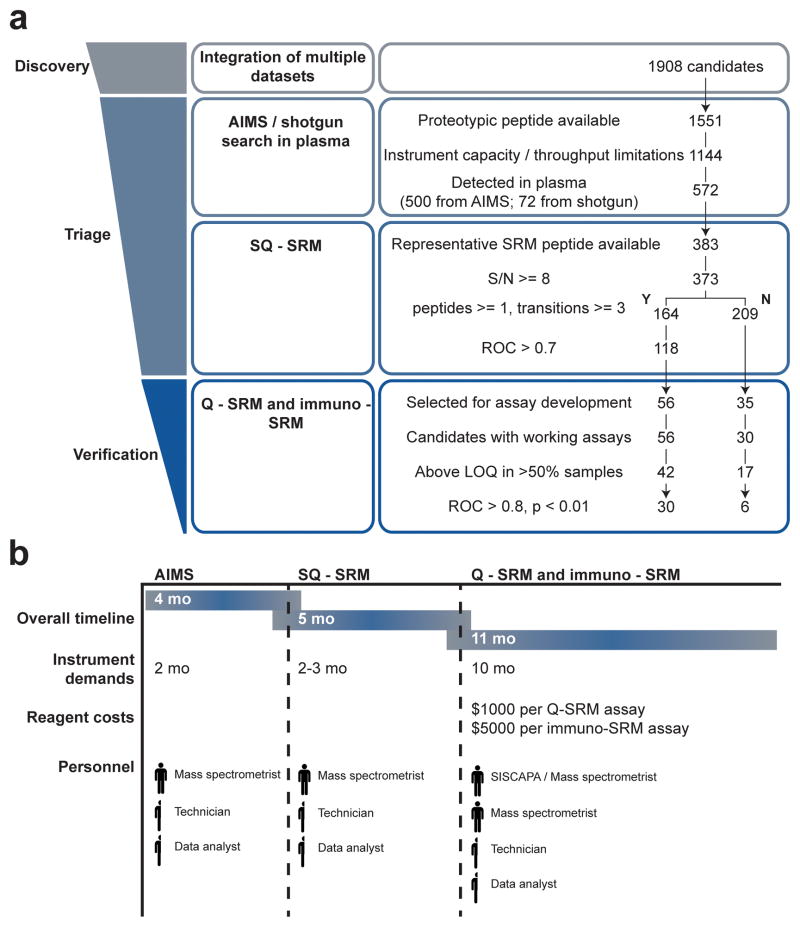
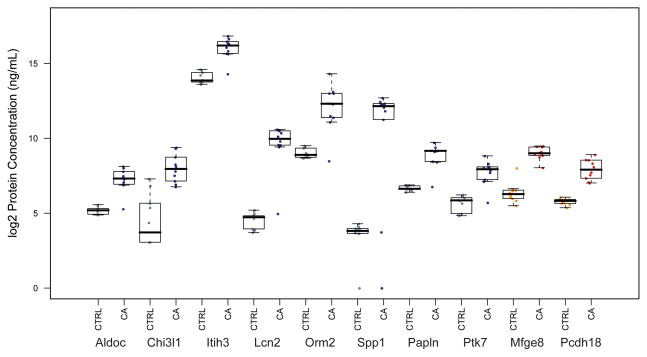
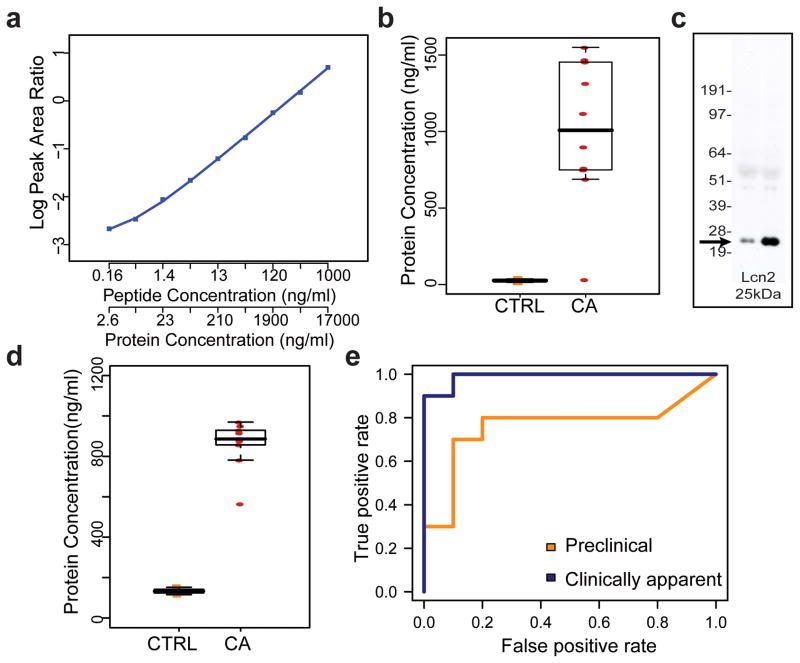
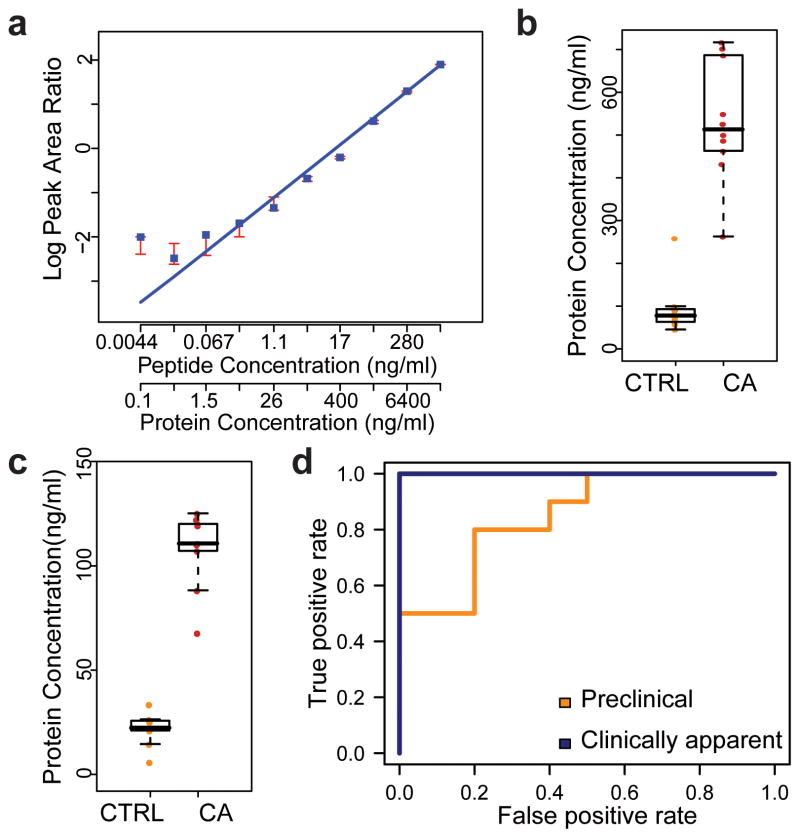
High-throughput technologies can now identify hundreds of candidate protein biomarkers for any disease with relative ease. However, because there are no assays for the majority of proteins and de novo immunoassay development is prohibitively expensive, few candidate biomarkers are tested in clinical studies. We tested whether the analytical performance of a biomarker identification pipeline based on targeted mass spectrometry would be sufficient for data-dependent prioritization of candidate biomarkers, de novo development of assays and multiplexed biomarker verification. We used a data-dependent triage process to prioritize a subset of putative plasma biomarkers from >1,000 candidates previously identified using a mouse model of breast cancer. Eighty-eight novel quantitative assays based on selected reaction monitoring mass spectrometry were developed, multiplexed and evaluated in 80 plasma samples. Thirty-six proteins were verified as being elevated in the plasma of tumor-bearing animals. The analytical performance of this pipeline suggests that it should support the use of an analogous approach with human samples.


Conflict of interest statement

COMPETING FINANCIAL INTERESTS

The authors declare no competing financial interests.

Figures

Figure 1
Figure 1
Multistage, targeted proteomic pipeline for triage and verification of biomarker candidates. (a) Overview of the workflow used to triage and verify candidate biomarkers, showing the flux of candidates at each stage of the pipeline. (b) Required resources for implementing the proteomic pipeline. The overall timeline includes time for data collection and analysis. For Q-SRM and immuno-SRM measurements, the overall timeline includes synthetic peptide quality control, development of SRM methods, acquisition of response curves and data analysis (but not the time required to generate antibodies, which can be interspersed with other activities). Instrument demands are summarized independently to provide an estimate of the required laboratory resources to carry out the study. Additional reagent costs (e.g., peptide standards and antibodies) are required for Q-SRM and immuno-SRM assays. Finally, the required personnel used in each phase of the study are denoted as full-time equivalents.
Figure 2
Figure 2
Concentrations of biomarker candidates in plasma of tumor-bearing animals compared to controls. The median value is plotted as a line with each box displaying the distribution of the inner quartiles with whiskers showing 95% of the data. Results shown are derived from the SRM-MS–based measurements in Supplementary Worksheet 6a (worksheet labeled “clinically apparent”). Gray and blue data points represent Q-SRM data, whereas orange and red data points represent immuno-SRM data. Cases and controls were matched with respect to age and gender, housed in the same cage, euthanized on the same day, and derived from different animals than those used in the discovery and prioritization experiments. (Although Aldoc and Chi3l1 meet significance based on P-values, their levels are near their assay LODs.) CA, clinically apparent tumors; CTRL, matched controls.
Figure 3
Figure 3
SRM-MS, ELISA and western blot analysis data confirm elevation of Lcn2 in plasma of tumor-bearing animals. (a) Response curve for the SRM-MS assay targeting a proteotypic peptide from Lcn2. The analytic %CV is 1.9% (at the LOQ), LOD is 10.5 ng protein/ml plasma and LOQ is 22.5 ng protein/ml plasma. (b) Distributions of concentrations of Lcn2 (inferred from the peptide concentration and assuming 100% recovery) in the mouse cohort with clinically apparent tumors (CA) and controls (CTRL). The median value is plotted as a line with each box displaying the distribution of the inner quartiles and whiskers showing 95% of the data. Results derived from the SRM-MS–based measurements in Supplementary Worksheet 6a. (c) Western blot analysis showing elevation of Lcn2 in plasma pools of tumor-bearing animals (lane 2) compared with healthy controls (lane 1). (d) Distributions of the concentrations of the Lcn2 in the mouse cohort with clinically apparent tumors (CA) and matched controls (CTRL), determined using a commercially available ELISA assay. The median value is plotted as a line with each box displaying the distribution of the inner quartiles and whiskers showing 95% of the data. Note that these are not the same plasma samples analyzed by SRM-MS in b. (e) ROC curve generated from the SRM-MS–based measurements of Lcn2 in the clinically apparent tumor cohort (blue line) and the preclinical mouse cohort (gold line).
Figure 4
Figure 4
Immuno-SRM and ELISA data confirm elevation of Mfge8 in plasma of tumor-bearing animals. (a) Response curve for the immuno-SRM-MS assay targeting a proteotypic peptide from Mfge8. The %CV is 10% (at the LOQ), LOD is 20.9 ng protein/ml plasma and LOQ is 48.4 ng protein/ml plasma. (b) Distributions of the concentration of Mfge8 (inferred from the peptide concentration and assuming 100% recovery) in the mouse cohort with clinically apparent tumors (CA) and matched controls (CTRL). The median value is plotted as a line with each box displaying the distribution of the inner quartiles and whiskers showing 95% of the data. Results shown are derived from the immuno-SRM-MS–based measurements in Supplementary Worksheet 6a. (c) Box plots show the distributions of the concentration of the Mfge8 protein in the mouse cohort with clinically apparent tumors (CA) and matched controls (CTRL), determined using a commercially available ELISA assay. These are the identical plasma samples analyzed by immuno-SRM-MS in b. The median value is plotted as a line with each box displaying the distribution of the inner quartiles and whiskers showing 95% of the data. (d) ROC curve generated from the immuno-SRM-MS–based measurements of Mfge8 in the clinically apparent tumor cohort (blue line) and the preclinical mouse cohort (gold line). The plot was derived from the immuno-SRM-MS data in Supplementary Worksheet 6a,b.

Comment in

  • Streamlining biomarker discovery.
    Latterich M, Schnitzer JE. Latterich M, et al. Nat Biotechnol. 2011 Jul 11;29(7):600-2. doi: 10.1038/nbt.1917. Nat Biotechnol. 2011. PMID: 21747385 No abstract available.

Similar articles

Cited by

References

    1. Anderson NL. The clinical plasma proteome: a survey of clinical assays for proteins in plasma and serum. Clin Chem. 2010;56:177–185. - PubMed
    1. Anderson NL, et al. A human proteome detection and quantitation project. Mol Cell Proteomics. 2009;8:883–886. - PMC - PubMed
    1. Bordeaux J, et al. Antibody validation. Biotechniques. 2010;48:197–209. - PMC - PubMed
    1. Haab BB, et al. A reagent resource to identify proteins and peptides of interest for the cancer community: a workshop report. Mol Cell Proteomics. 2006;5:1996–2007. - PubMed
    1. Stoevesandt O, Taussig MJ. Affinity reagent resources for human proteome detection: initiatives and perspectives. Proteomics. 2007;7:2738–2750. - PubMed

Publication types