. 2011 Jun 19;43(7):630-8.
doi: 10.1038/ng.857.

CTCF-mediated functional chromatin interactome in pluripotent cells

Affiliations

CTCF-mediated functional chromatin interactome in pluripotent cells

Lusy Handoko et al. Nat Genet. .

Erratum in

  • Nat Genet. 2011 Aug;43(8):815

Abstract

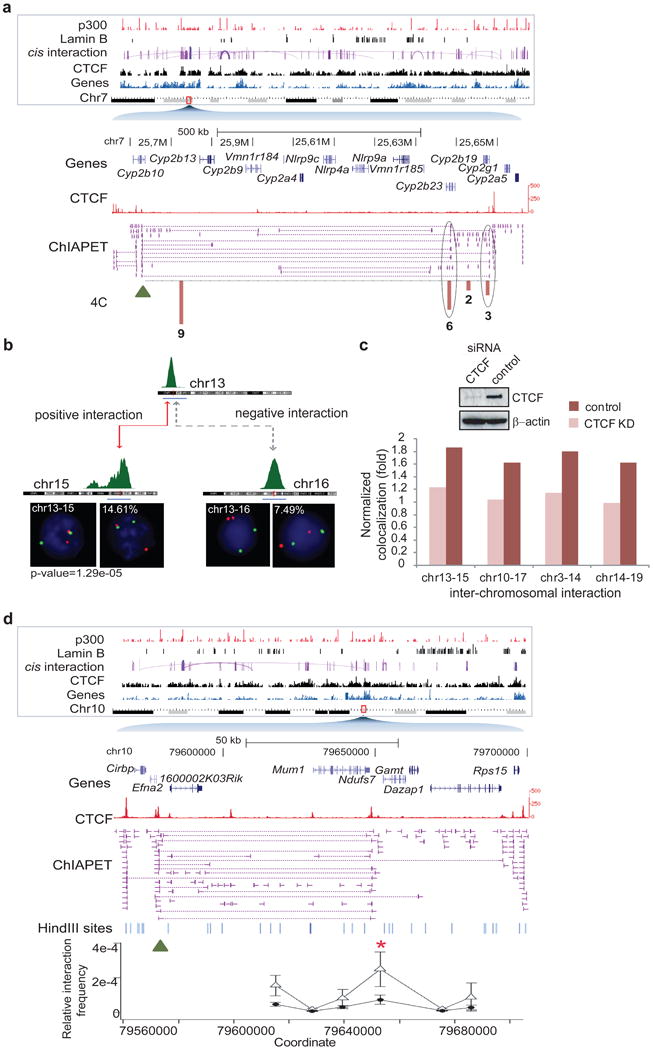
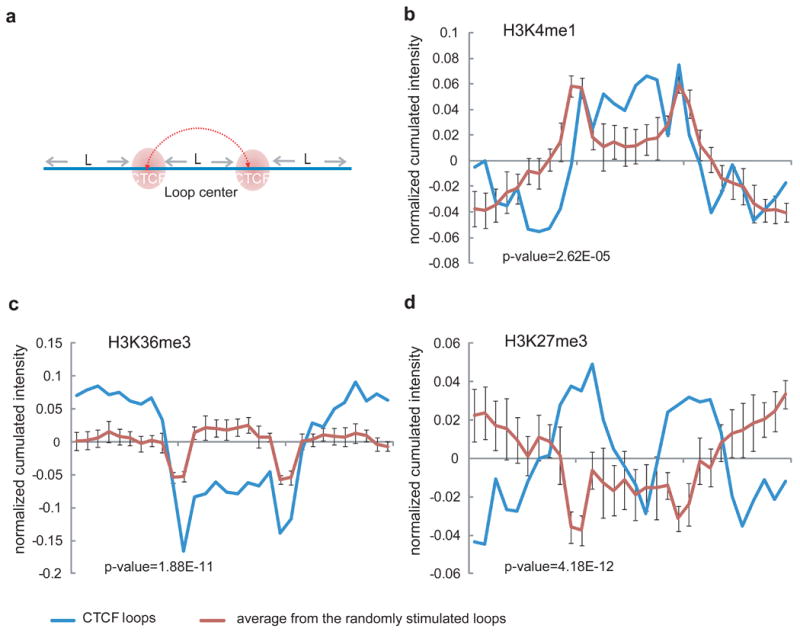
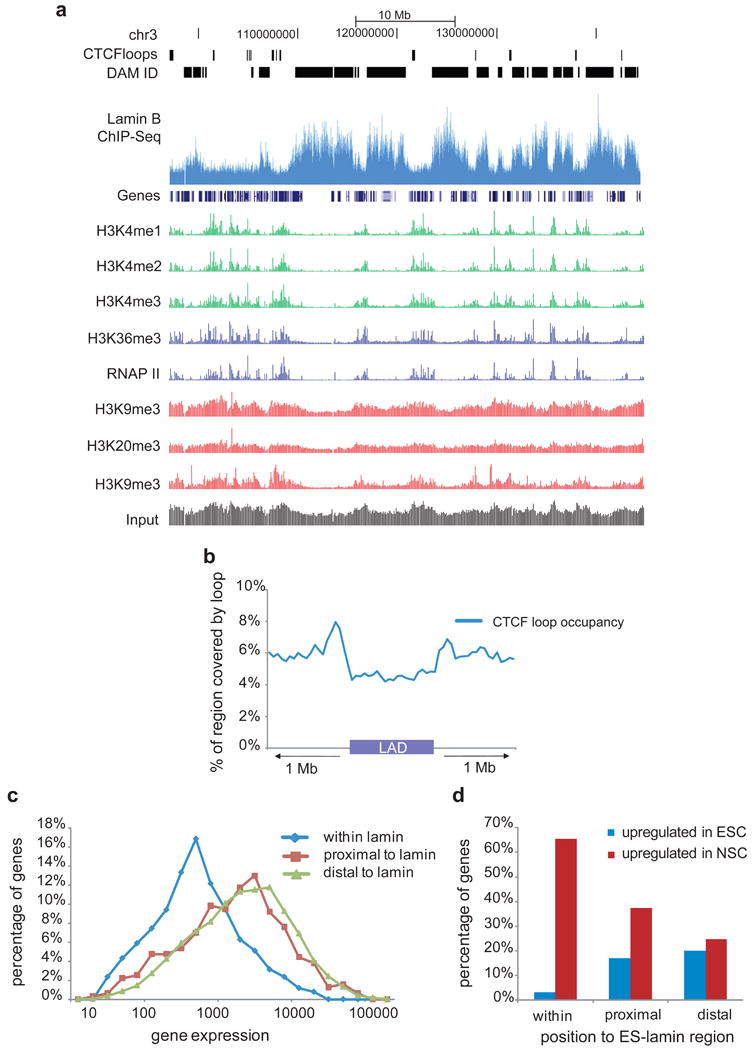
Mammalian genomes are viewed as functional organizations that orchestrate spatial and temporal gene regulation. CTCF, the most characterized insulator-binding protein, has been implicated as a key genome organizer. However, little is known about CTCF-associated higher-order chromatin structures at a global scale. Here we applied chromatin interaction analysis by paired-end tag (ChIA-PET) sequencing to elucidate the CTCF-chromatin interactome in pluripotent cells. From this analysis, we identified 1,480 cis- and 336 trans-interacting loci with high reproducibility and precision. Associating these chromatin interaction loci with their underlying epigenetic states, promoter activities, enhancer binding and nuclear lamina occupancy, we uncovered five distinct chromatin domains that suggest potential new models of CTCF function in chromatin organization and transcriptional control. Specifically, CTCF interactions demarcate chromatin-nuclear membrane attachments and influence proper gene expression through extensive cross-talk between promoters and regulatory elements. This highly complex nuclear organization offers insights toward the unifying principles that govern genome plasticity and function.


Figures

Figure 1
Figure 1
Genome-wide CTCF mediated chromatin interactome. (a) Circos map of whole genome CTCF chromatin interactome, associated genes, p300 and Lamin B occupancies from chr.1 to chr.X. The circos was generated using the Circos software package (http://mkweb.bcgsc.ca/circos/). Inter-chromosomal interactions are drawn in the inner-most ring. This is followed by the gene density track (dark green). The CTCF track (black) shows the peak signals of CTCF, followed by the intra-chromosomal interactions. The Lamin B track (dark grey) represents the peak signals of Lamin B. The p300 track (red) shows the fold change between the sample and the control. (b) An expanded view of the interactions found from chr. 13, 14 and 15. Profiles shown in different tracks from inner to outer rings are listed accordingly. The intensity of the color is proportional to the PET counts in the cluster as shown. (c) Chromosome-wide view of all the intra-chromosomal interactions detected on chr.10. The content shown each track is labeled on the side.
Figure 2
Figure 2
Validation of CTCF-mediated chromatin interactions (a) A region on chr7:25,586,953- 26,569,774 harboring a cis-interaction cluster with Cyp2 gene family is shown as purple lines connecting CTCF binding sites (red peaks). Numbers on the lower panel show the frequencies of the interactions detected by independent 4C sequence reads. Triangle mark indicates the anchored primer location. The confirmed interactions are circled. (b) FISH analysis confirms the trans-interaction between chr.13:13,658,687 and chr.15:74,912,106 (red line). The co-localization is shown as staining of red and green fusion spots. In the control experiment (dotted line), the co-localization percentage of the negative control region (chr.16:52,100,818) is significantly lower (7.5% vs. 14.6%). (c) FISH on CTCF knock-down cells. mES cells were transfected with CTCF siRNA (CTCF kd cells) or control siRNA (control cells). Western blot shows that CTCF protein in the CTCF kd cells was less than 10% of that in the control cells. The co-localization ratio were tested for 4 interaction loci (X axis). The Y axis is the fold change of the co-localization frequency between the interaction and the negative control loci. (d) Chromosome-wide view of the cis-interactions detected on chr.10 (top). Middle: detailed view of a 70 Kb loop harboring Efna2 and Mim1 genes between 79,564,519-79,700,518. Bottom: 3C validation between the anchor (green triangle) and the distal site (red star) in the control cells (white triangle) and the CTCF kd cells (black square). Y axis is the relative interaction frequency and X axis displays the genomic coordinates. HindIII sites are marked in blue.
Figure 3
Figure 3
Cumulative histone modification patterns of CTCF loops (a) The loop model. The 1,295 loops with span less than 1Mb and their neighboring regions were first aligned; the same distance L of the loop span is extended to the upstream and downstream outside of the loop boundaries. For each histone modification, normalized histone modification signals are determined from the total distance 3L. and then normalized by their sequencing depth. A set of 1,295 negative control loops randomly selected from 2M+ pairs of CTCF binding sites with similar distribution of spans and CTCF binding affinities were constructed as control. The cumulative normalized signals of H3K4me1 (b), H3K36me3 (c) and H3K27me3 (d) were plotted for the comparison between CTCF loops and control loops. The intensity plots exhibit the significant different patterns between the CTCF loops and simulated control loops. The random process was repeated for 10 times to calculate the p-value as shown.
Figure 4
Figure 4
Distinct types of chromatin domains defined by CTCF tethered interactions. (a) Five chromatin domains demarcated by CTCF loops through clustering of seven histone modification signatures. For each loop region, the same distance L is extended upstream and downstream of the loop boundaries. Normalized signals of 7 histone modifications (listed on the top) from the total distance 3L (left, within and right of the loops) are determined for each loop and shown as one row. Loops exhibiting the similar combinatory signatures are clustered and symmetric clusters are grouped. The percentage of loops found in each category is listed on the left. (b) Correlation of unique histone modification signatures with loop span. CTCF loops are sorted in ascending order of span and the hisone patterns associated with different spans are shown. Each column coresponds to an aligned bin and each row corresponds to CTCF-associated loops. A window containing 100 CTCF loops is moved vertically to average the signal. A clear transition of the histone patterns that differentiates active signals from inactive signals is observed at ∼200k. (c) The proposed models of Category I - IV based on the histone and RNAP II intensity profiles.
Figure 5
Figure 5
Promoter-p300 communications facilitated by CTCF-associated chromatin interactions. (a) A cis-interaction cluster (chr10:76,552,662-76,718,442; shown in connecting purple lines) between CTCF binding sites (red peaks) connects the promoter of Pofut2 (blue gene track) with its p300 enhancer binding site (green) located 124 Kb 5′. RNA-Seq signal (dark red) detected for Pofut2 expression is shown as the track on top panel. (b) Percentage of genes up-regulated in ES cells compared to NS cells from 1). Genes whose promoters and nearest p300 binding distances are less than 10 Kb, 2). Genes whose promoters and nearest p300 are brought in close proximity by CTCF interactions to less than 10 Kb and 3). Genes whose promoters with distal p300 binding are more than 10 Kb apart. The ES cells and NS cells gene expression data were derived from the microarray experiments done by Mikkelsen et al., (c) Expression of the genes whose promoters are connected to p300 enhancer by CTCF-associated loops. Gene expression was assessed by Real time PCR from the CTCF knock-down and control cells. Western blot shows the CTCF protein level in CTCF KD cells compared to the control cells. The expression levels were normalized against the house-keeping gene, Gapdh and calculated from two independent qPCR reactions of 2 independent siRNA experiments (total 2×2 qPCR). The expression levels of the genes in the CTCF knock-down cells were then normalized against those of in the control cells (=1). p-value calculated by t-test is indicated. ***: p-value ≤9.54E-05, **: p-value ≤5.01E-03, *: p-value ≤1.26E-02
Figure 6
Figure 6
Lamin-Associated Domains (LADs) in ES cells (a) Multiple LADs found in a 47.4 Mb interval (chr3:97,107,505-144,477,019) represented by the profile of fold change between ChIP-Seq signal and input background (light blue track). As a comparison, LADs determined by DamID from murine ES cells are shown in black bars and CTCF loops are shown above the LAD tracks. Gene density and histone modification profiles are shown in the lower panels. (b) CTCF loop occupancy profile within LADs and up to 1 Mb outside of LAD boundaries. (c) Genes associated with LADs are transcriptional repressed. The distributions of gene expression levels with different locations relative to LADs are plotted. X-axis is the log value of gene expression based on Ivanova's microarray dataset and the Y-axis is the percentage of genes. (d) Percentage of genes up-regulated in ES (blue bars) or NS cells (red bars) relative to their locations to LADs are shown. Genes located within or in close proximity with LADs are preferentially up-regulated. 64% of the LAD-associated genes are up-regulated in NS cells.

Comment in

References

    1. Francastel C, Schubeler D, Martin DI, Groudine M. Nuclear compartmentalization and gene activity. Nat Rev Mol Cell Biol. 2000;1:137–43. - PubMed
    1. Misteli T. Beyond the sequence: cellular organization of genome function. Cell. 2007;128:787–800. - PubMed
    1. Bolzer A, et al. Three-dimensional maps of all chromosomes in human male fibroblast nuclei and prometaphase rosettes. PLoS Biol. 2005;3:e157. - PMC - PubMed
    1. Misteli T, Soutoglou E. The emerging role of nuclear architecture in DNA repair and genome maintenance. Nat Rev Mol Cell Biol. 2009;10:243–54. - PMC - PubMed
    1. Meshorer E, Misteli T. Chromatin in pluripotent embryonic stem cells and differentiation. Nat Rev Mol Cell Biol. 2006;7:540–6. - PubMed

Publication types

MeSH terms

Associated data