. 2011 Jun 19;43(7):639-47.
doi: 10.1038/ng.860.

A genetic interaction network of five genes for human polycystic kidney and liver diseases defines polycystin-1 as the central determinant of cyst formation

Affiliations

A genetic interaction network of five genes for human polycystic kidney and liver diseases defines polycystin-1 as the central determinant of cyst formation

Sorin V Fedeles et al. Nat Genet. .

Abstract

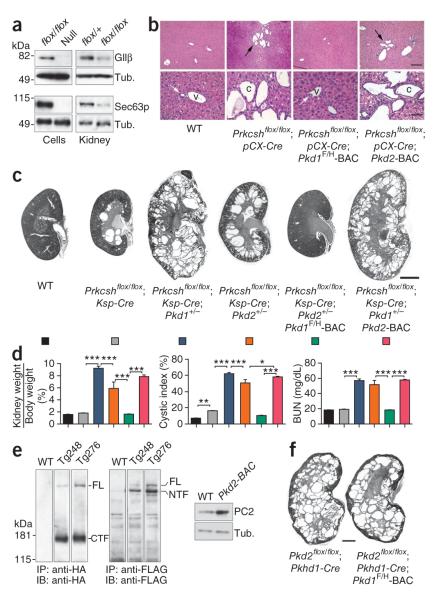
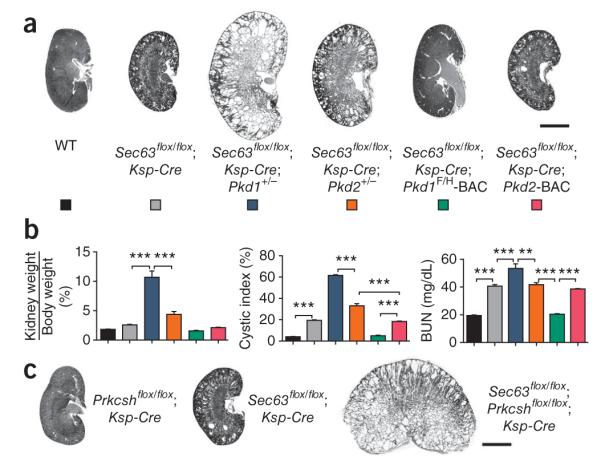
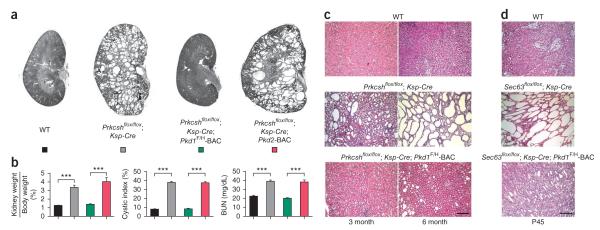
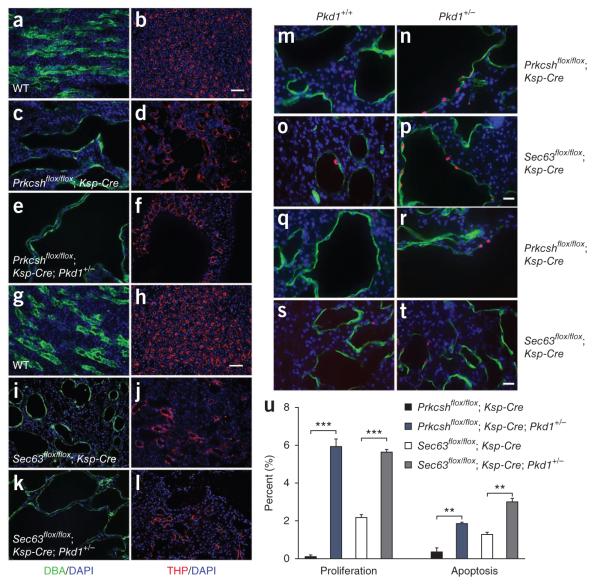
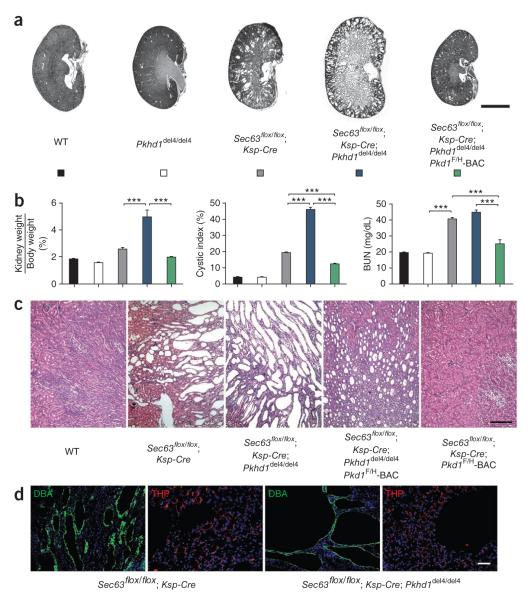
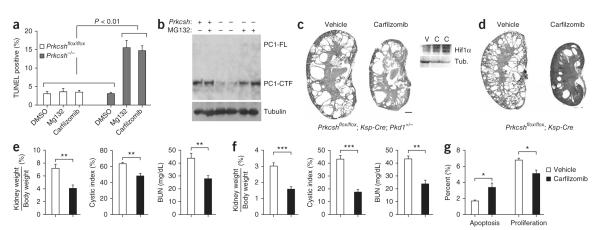
Autosomal dominant polycystic liver disease results from mutations in PRKCSH or SEC63. The respective gene products, glucosidase IIβ and SEC63p, function in protein translocation and quality control pathways in the endoplasmic reticulum. Here we show that glucosidase IIβ and Sec63p are required in mice for adequate expression of a functional complex of the polycystic kidney disease gene products, polycystin-1 and polycystin-2. We find that polycystin-1 is the rate-limiting component of this complex and that there is a dose-response relationship between cystic dilation and levels of functional polycystin-1 following mutation of Prkcsh or Sec63. Reduced expression of polycystin-1 also serves to sensitize the kidney to cyst formation resulting from mutations in Pkhd1, the recessive polycystic kidney disease gene. Finally, we show that proteasome inhibition increases steady-state levels of polycystin-1 in cells lacking glucosidase IIβ and that treatment with a proteasome inhibitor reduces cystic disease in orthologous gene models of human autosomal dominant polycystic liver disease.


Figures

Figure 1
Figure 1
Pkd1 dosage is the main genetic determinant of Prkcsh-dependent cyst formation. (a) Prkcshflox (top) and Sec63flox (bottom) produce null alleles upon deletion. In the left panels, GIIβ and Sec63p disappear from kidney cell lines (flox/flox) following Cre expression (null). In the right panels, GIIβ and Sec63p are markedly reduced in mosaic Prkcshflox/flox; Ksp-Cre and Sec63flox/flox; Ksp-Cre kidney tissue (flox/flox) compared to heterozygous controls. (b) Prkcshflox/flox; pCX-CreER mice, with inducible Cre expression in bile duct epithelia, develop liver cysts 8 weeks after treatment with tamoxifen from P28-P32 (black arrows). Expression of the Pkd1F/H-BAC transgene, but not Pkd2-BAC, abrogates bile duct cyst formation (white arrows). v, venule; c, cyst. Scale bars, 500 μm in the upper panels and 100 μm in the lower panels. (c) The severity of cystic disease is markedly increased on the Pkd1+/− background and moderately increased on the Pkd2+/− background. The Pkd1F/H-BAC transgene rescues the Prkcshflox/flox; Ksp-Cre;Pkd2+/− cystic phenotype; Pkd2-BAC has no effect. Ages, P42; scale bar, 2 mm. (d) Quantitative assessment of cyst severity by kidney weight to body weight ratio, cystic index and BUN. The colors of histogram bars correspond to the genotypes in c. n = 7 for each group except Prkcshflox/flox; Ksp-Cre; Pkd1+/−, for which n = 8. Results are mean ± s.e.m. (ANOVA; ***P < 0.001, *P < 0.05). (e) Immunoblots with anti-HA (left) and anti-FLAG (middle) showing PC1 expression in membrane-enriched kidney tissue lysates from two representative Pkd1F/H-BAC transgenic lines (Tg248 and Tg276). The majority of PC1 is cleaved in vivo. Tg248 was used in the current study. Transgenic PC2 overexpression in the liver of littermate mice (right). WT, non-transgenic. (f) Absence of phenotypic effect in Pkd2flox/flox; Pkhd1-Cre mice with or without the Pkd1F/H-BAC transgene (P21). Scale bar, 1 mm.
Figure 2
Figure 2
Pkd1 and Pkd2 dosage in Sec63-dependent cyst formation. (a,b) Histological kidney sections (a) and aggregate data (b) from mice with the indicated genotypes at P21. The Pkd1+/− and Pkd2+/− backgrounds exacerbate cyst formation following loss of Sec63; the increase in severity is greater with Pkd1+/− than with Pkd2+−. The Pkd1F/H-BAC transgene rescues the PKD in Sec63flox/flox; Ksp-Cre mice. The Pkd2-BAC transgene has no effect. Genotypes in the histograms (b) are indicated by the colors in a; n (from left to right) = 5, 8, 8, 9, 7, 5. Results are mean ± s.e.m. (ANOVA; ***P < 0.001, **P < 0.01). (c) Sec63flox/flox; Prkcshflox/flox; Ksp-Cre doubly mutant mice show genetic interaction between Prkcsh and Sec63, with marked exacerbation of the cystic phenotype compared to either Prkcshflox/flox; Ksp-Cre or Sec63flox/flox; Ksp-Cre mice at P21. Scale bar, 2 mm.
Figure 3
Figure 3
Impaired biogenesis and trafficking of PC1 in ADPLD. (a) Immunoblots showing steady state expression of PC1 from the Pkd1F/H-BAC transgene in Prkcshflox/flox; Pkd1F/H-BAC (flox/flox) control and Prkcsh−/−; Pkd1F/H-BAC null cells lines. Left panel, immunoblot of total cell lysates with anti-HA; right panel, immunoblot following immunoprecipitation by anti-HA showing reduction in both the intramembranous PC1-CTF and uncleaved full-length PC1 (PC1-FL). Densitometric quantitation of PC1-CTF normalized to tubulin shows PC1 levels in null cells are ~48% of their respective controls (n = 4; **P = 0.0060; results shown as mean ± s.e.m. (Student’s t-test)). (b) Representative immunoblots showing PC2 expression in cell lines and kidney tissues. Densitometric quantitation normalized to tubulin shows that PC2 levels in null cells and cystic kidneys are reduced to ~66% of their respective controls (n = 4 for cell lines; n = 3 each for kidneys; *P = 0.0152, **P = 0.0095; mean ± s.e.m. (Student’s t-test)). (c) Endo H resistant fraction (R, upper band) of PC1-CTF is markedly reduced and the Endo H sensitive fraction (S, lower band) is increased in Prkcsh−/−; Pkd1F/H-BAC cells (null) compared to Prkcshflox/flox; Pkd1F/H-BAC controls (flox/flox), indicating reduced trafficking of PC1-CTF past the middle Golgi in null cells (d,e). Expression of PC2 (d) and PC1 (e) in cilia of Prkcshflox/flox; Pkd1F/H-BAC control and Prkcsh−/−; Pkd1F/H-BAC null cells. PC2 trafficking to cilia is not altered by loss of GIIβ (d), whereas PC1 trafficking is markedly reduced in cilia (the arrow marks the weak PC1-HA signal) (e). Red, acetylated α-tubulin; green, anti-PC2 in d and anti-HA in e. Scale bar, 5 μm.
Figure 4
Figure 4
Late stage tubule dilation in Prkcsh and Sec63 mutant kidneys overexpressing PC1 (a,b). Histological kidney sections (a) and aggregate data (b) from mice with the indicated genotypes at 3 months of age. Rescue by the Pkd1F/H-BAC remains complete through 3 months; Pkd2-BAC has no effect. n (from left to right) = 6, 7, 7, 5. Results are mean ± s.e.m. (ANOVA; ***P < 0.001). (c) Histological examination of Prkcsh mutant kidneys with the indicated genotypes at 3 and 6 months. The occurrence of microscopic tubule dilation at 6 months in Prkcshflox/flox; Ksp-Cre; Pkd1F/H-BAC kidneys shows that PC1-dependent cyst growth is a function of both gene dosage and time. (d) Mild onset cystic dilation in Sec63flox/flox; Ksp-Cre; Pkd1F/H-BAC at P45 (bottom panel) indicate similar temporal effects in Sec63 mutants. Scale bars, 500 μm.
Figure 5
Figure 5
Nephron segment-specific sensitivity to Pkd1 dosage-dependent proliferation and cyst growth. (a–l) Immunocytochemical analysis of Prkcsh mutant kidneys at P42 (a–f) and Sec63 mutant kidneys at P21 (g–l) showing the increased size of collecting duct cysts (green) resulting from the Pkd1+/− background (c,e,i,k). Thick ascending limb cysts (red) are unchanged by reduced dosage of Pkd1 (d,f,j,l). DBA, dolichos biflorus agglutinin; THP, Tamm Horsfall protein. Scale bars, 50 μm. (m–p) Representative images showing nuclear BrdU incorporation following five daily injections ending at P42 (m,n) or a single injection 3 h before being killed on P21 (o,p) to determine the impact on cyst proliferation of two copies of Pkd1 (m,o) compared to a single copy (n,p). We determined the comparative proliferation rates by counting >1,000 DBA-positive cystic collecting duct cells per kidney from six kidneys for each genotype. BrdU-positive nuclei are shown in red, DBA is green and DAPI is blue. Scale bar, 20 μm. For both ADPLD models, the increased growth of collecting duct cysts with reduced PC1 dosage on the Pkd1+/− background was associated with increased proliferation (u) (***P < 0.001; mean ± s.e.m.; Student’s t-test). (q–t) Representative images comparing apoptotic rates by TUNEL staining (red) for both ADPLD models as a function of Pkd1 dosage. (u) Apoptotic rates measured as above showed more modest increases on the Pkd1+/− background (u) (**P < 0.01; mean ± s.e.m.; Student’s t-test), suggesting that the proliferative effects predominate. DBA, green; scale bar, 20 μm.
Figure 6
Figure 6
Genetic interaction of Pkhd1, Pkd1 and Sec63. (a–c) Histological kidney sections (a,c) and aggregate structural and functional data (b) from mice with the indicated genotypes at P21. The Pkhd1del4/del4 background results in increased severity of polycystic disease in Sec63 mutant kidneys. PC1 overexpression rescues the worsened Sec63flox/flox; Ksp-Cre; Pkhd1del4/del4 phenotype to a level that is milder than Sec63flox/flox; Ksp-Cre alone (a–c), although microscopic cysts persist (c). Genotypes in the histograms (b) are indicated by the colors in a; n (from left to right) = 5, 6, 8, 6, 6. Results are mean ± s.e.m.; ANOVA; ***P < 0.001. (d) Immunocytochemical analysis of Sec63 mutant kidneys at P21 showing the increased size of collecting duct cysts (green) resulting from the Pkhddel4/del4 background. Thick ascending limb cysts (red) are unchanged. Scale bars, 2 mm (a); 500 μm (c); 50 μm (d).
Figure 7
Figure 7
Proteasome inhibitor therapy ameliorates cyst formation following loss of Prkcsh. (a) Prkcsh−/− cells have increased sensitivity to proteasome inhibitors (n = 3 independent wells for each genotype and treatment). Results are shown as mean ± s.e.m. (Student’s t-test). (b) Prkcsh−/−; Pkd1F/H-BAC cells treated with MG132 (10 μM for 16 h) showed increased levels of PC1. (c) Representative images of kidneys from Prkcshflox/flox; Ksp-Cre; Pkd1+/− mice treated twice weekly with carfilzomib (5 mg/kg) for 3 weeks beginning at P21. Effective inhibition of proteasome function is indicated by increased Hif1 α expression in carfilzomib-treated kidneys (C) compared to the vehicle-treated controls (V). Scale bar, 1 mm. (d) Representative images of kidneys from Prkcshflox/flox; Ksp-Cre mice treated with carfilzomib (5 mg/kg) for 6 weeks beginning at P42. (e) Aggregate data for Prkcshflox/flox; Ksp-Cre; Pkd1+/− mice showing improvement following carfilzomib treatment (n = 6, carfilzomib group; n = 5, vehicle group; results are mean ± s.e.m.; Student’s t-test; **P = 0.0011 (weight ratios), P = 0.0082 (cystic index), **P = 0.0084 (BUN)). (f) Aggregate data for Prkcshflox/flox; Ksp-Cre mice showing improvement in the carfilzomib-treated group (n = 6, carfilzomib group; n = 3, vehicle group; results are mean ± s.e.m.; Student’s t-test; ***P = 0.0007 (weight ratios), P < 0.0001 (cystic index), P = 0.0032 (BUN)). (g) The rate of apoptosis is increased (*P = 0.034), and the rate of proliferation decreased (*P = 0.025) in cyst-lining epithelia following treatment with carfilzomib in Prkcshflox/flox; Ksp-Cre; Pkd1+/− mice at P42. Results are mean ± s.e.m. (Student’s t-test).

Comment in

References

    1. Qian Q, et al. Clinical profile of autosomal dominant polycystic liver disease. Hepatology. 2003;37:164–171. - PubMed
    1. Reynolds DM, et al. Identification of a locus for autosomal dominant polycystic liver disease, on chromosome 19p13.2-13.1. Am. J. Hum. Genet. 2000;67:1598–1604. - PMC - PubMed
    1. Li A, et al. Mutations in PRKCSH cause isolated autosomal dominant polycystic liver disease. Am. J. Hum. Genet. 2003;72:691–703. - PMC - PubMed
    1. Davila S, et al. Mutations in SEC63 cause autosomal dominant polycystic liver disease. Nat. Genet. 2004;36:575–577. - PubMed
    1. Drenth JP, Te Morsche RH, Smink R, Bonifacino JS, Jansen JB. Germline mutations in PRKCSH are associated with autosomal dominant polycystic liver disease. Nat. Genet. 2003;33:345–347. - PubMed

Publication types

MeSH terms

Substances

Supplementary concepts