

Quantifying Tight Junction Disruption Caused by Biomimetic pH-Sensitive Hydrogel Drug Carriers
- PMID: 21686051
- PMCID: PMC3115533
- DOI: 10.1016/s1773-2247(08)50006-2
Quantifying Tight Junction Disruption Caused by Biomimetic pH-Sensitive Hydrogel Drug Carriers
Abstract
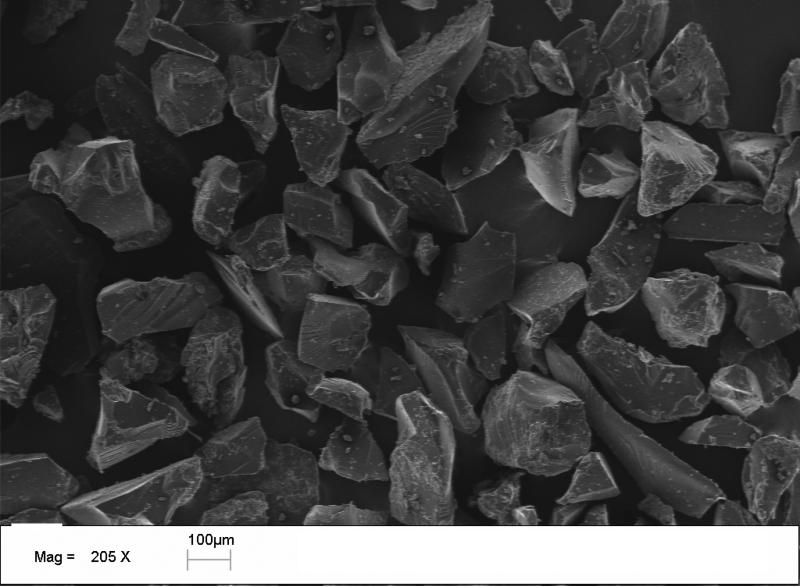
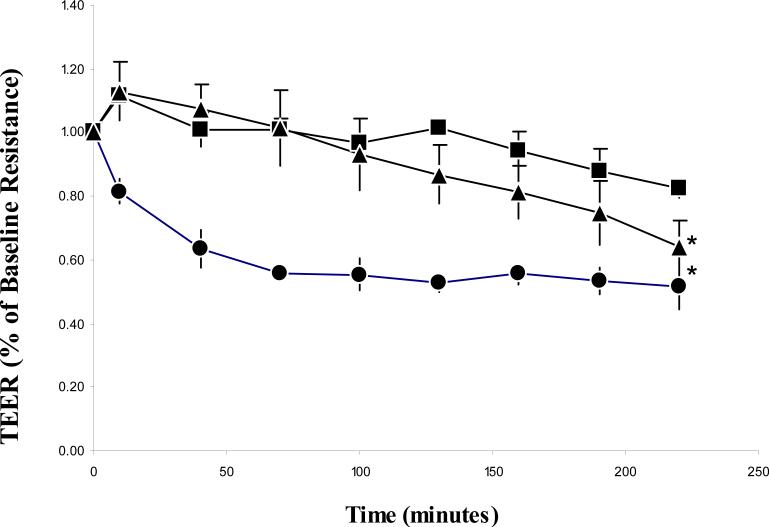
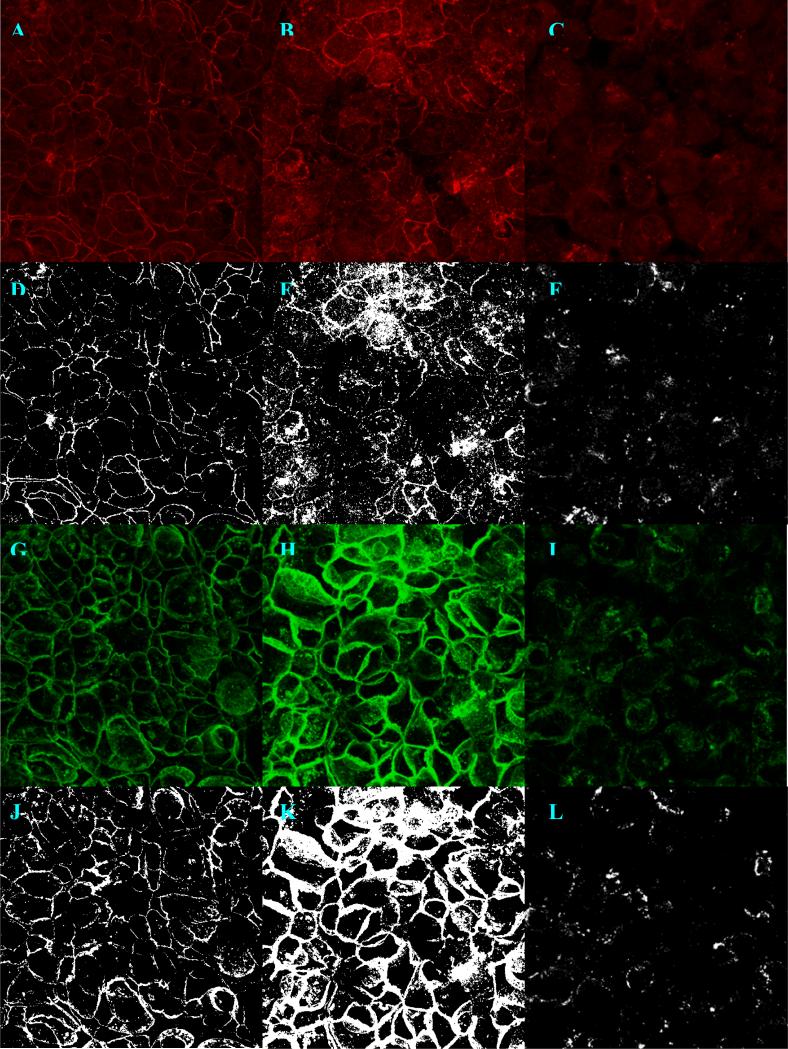
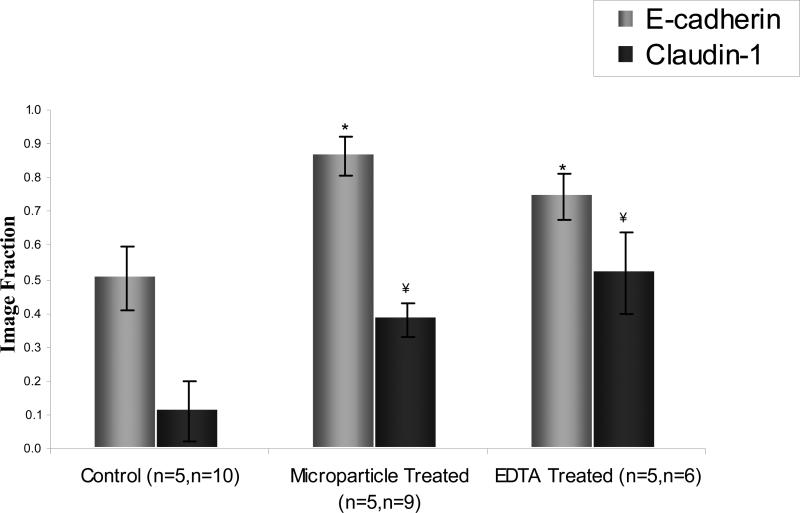
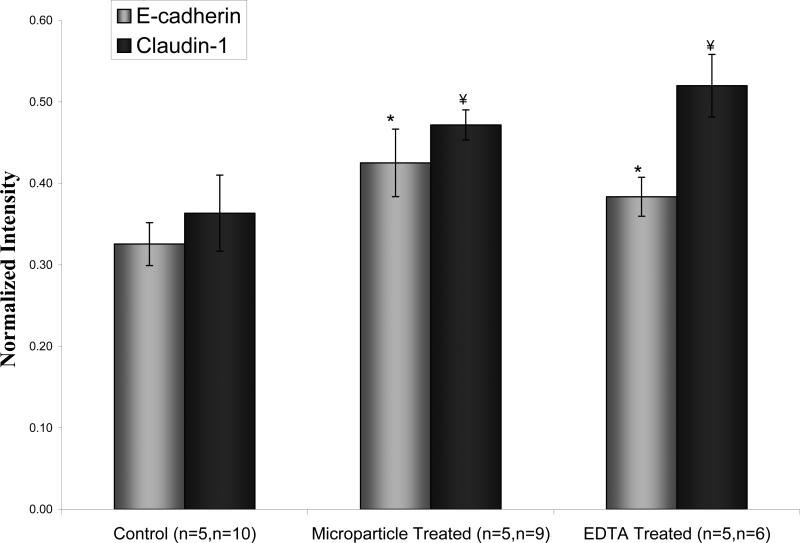
Facilitation of protein transport across biomimetic polymers and carriers used in drug delivery is a subject of major importance in the field of oral delivery. Quantitative immunofluorescence of epithelial tight junctions can be a valuable tool in the evaluation of paracellular permeation enhancement and macromolecular drug absorption. The tight junctional space is composed of transmembrane protein networks that provide both mechanical support and a transport barrier. Both of these may be affected by drug delivery agents that enhance paracytosis. Imaging is the only tool that can tease apart these processes. A confocal microscopy imaging method was developed to determine the effect of microparticulate poly(methacrylic acid) grafted poly(ethylene glycol) (P(MAA-g-EG)) hydrogel drug carriers on the integrity of claudin-1 and E-cadherin networks in Caco-2 monolayers. Z-stack projection images showed the lateral disruption of tight junctions in the presence of drug carriers. Tight junction image fraction measurements showed more significant differences between membranes exposed to microparticles and a control group. Mechanical disruption was much more pronounced in the presence of P(MAA-g-EG) microparticles as compared to the effect of EDTA.
Figures
Similar articles
-
Novel complexation hydrogels for oral peptide delivery: in vitro evaluation of their cytocompatibility and insulin-transport enhancing effects using Caco-2 cell monolayers.J Biomed Mater Res A. 2003 Nov 1;67(2):609-17. doi: 10.1002/jbm.a.10128. J Biomed Mater Res A. 2003. PMID: 14566804 Free PMC article.
-
Wheat germ agglutinin functionalized complexation hydrogels for oral insulin delivery.Biomacromolecules. 2008 Apr;9(4):1293-8. doi: 10.1021/bm701274p. Epub 2008 Mar 11. Biomacromolecules. 2008. PMID: 18330990 Free PMC article.
-
Transport of octreotide and evaluation of mechanism of opening the paracellular tight junctions using superporous hydrogel polymers in Caco-2 cell monolayers.J Pharm Sci. 2004 Mar;93(3):743-52. doi: 10.1002/jps.10570. J Pharm Sci. 2004. PMID: 14762912
-
Potential use of tight junction modulators to reversibly open membranous barriers and improve drug delivery.Biochim Biophys Acta. 2009 Apr;1788(4):892-910. doi: 10.1016/j.bbamem.2008.09.016. Epub 2008 Oct 17. Biochim Biophys Acta. 2009. PMID: 18983815 Review.
-
Enteric Pathogens and Their Toxin-Induced Disruption of the Intestinal Barrier through Alteration of Tight Junctions in Chickens.Toxins (Basel). 2017 Feb 10;9(2):60. doi: 10.3390/toxins9020060. Toxins (Basel). 2017. PMID: 28208612 Free PMC article. Review.
Cited by
-
Tsr Chemoreceptor Interacts With IL-8 Provoking E. coli Transmigration Across Human Lung Epithelial Cells.Sci Rep. 2016 Aug 10;6:31087. doi: 10.1038/srep31087. Sci Rep. 2016. PMID: 27506372 Free PMC article.
-
Chronic stress and intestinal barrier dysfunction: Glucocorticoid receptor and transcription repressor HES1 regulate tight junction protein Claudin-1 promoter.Sci Rep. 2017 Jul 3;7(1):4502. doi: 10.1038/s41598-017-04755-w. Sci Rep. 2017. PMID: 28674421 Free PMC article.
-
Transmigration of Trypanosoma brucei across an in vitro blood-cerebrospinal fluid barrier.iScience. 2022 Mar 1;25(4):104014. doi: 10.1016/j.isci.2022.104014. eCollection 2022 Apr 15. iScience. 2022. PMID: 35313698 Free PMC article.
-
Ethanol impairs intestinal barrier function in humans through mitogen activated protein kinase signaling: a combined in vivo and in vitro approach.PLoS One. 2014 Sep 16;9(9):e107421. doi: 10.1371/journal.pone.0107421. eCollection 2014. PLoS One. 2014. PMID: 25226407 Free PMC article.
-
Storming the gate: New approaches for targeting the dynamic tight junction for improved drug delivery.Adv Drug Deliv Rev. 2023 Aug;199:114905. doi: 10.1016/j.addr.2023.114905. Epub 2023 Jun 3. Adv Drug Deliv Rev. 2023. PMID: 37271282 Free PMC article. Review.
References
-
- Blanchette J, Kavimandan N, Peppas NA. Principles of transmucosal delivery of therapeutic agents. Biomed Pharmacother. 2004;58:142–51. - PubMed
-
- Mullin JM, Agostino N, Rendon-Huerta E, Thornton JJ. Keynote review: epithelial and endothelial barriers in human disease. Drug Discov Today. 2005;10:395–408. - PubMed
-
- Madsen F, Peppas NA. Complexation graft copolymer networks: swelling properties, calcium binding and proteolytic enzyme inhibition. Biomaterials. 1999;20:1701–1708. - PubMed
-
- Grasset E, Pinto M, Dussaulx E, Zweibaum A, Desjeux JF. Epithelial properties of human colonic carcinoma cell line Caco-2: electrical parameters. Am J Physiol. 1984;247:C260–C267. - PubMed
Grants and funding
LinkOut - more resources
Full Text Sources