. 2009:2009:bcr07.2008.0503.
doi: 10.1136/bcr.07.2008.0503. Epub 2009 Jan 23.

Identification of a novel PEX14 mutation in Zellweger syndrome

Affiliations

Identification of a novel PEX14 mutation in Zellweger syndrome

Sofie J Huybrechts et al. BMJ Case Rep. 2009.

Abstract

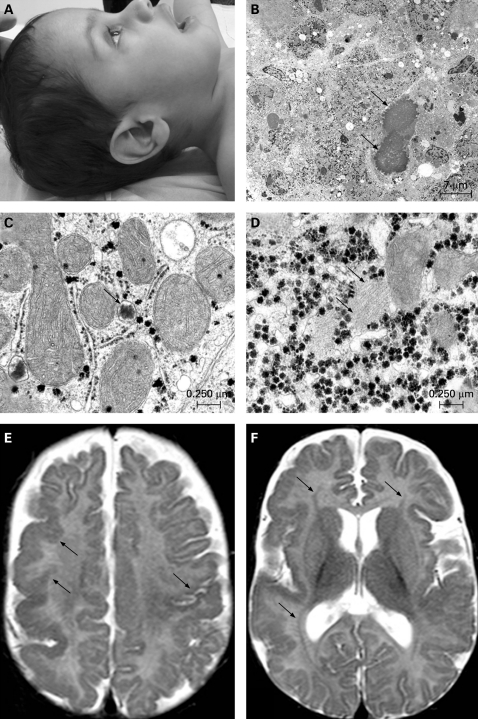
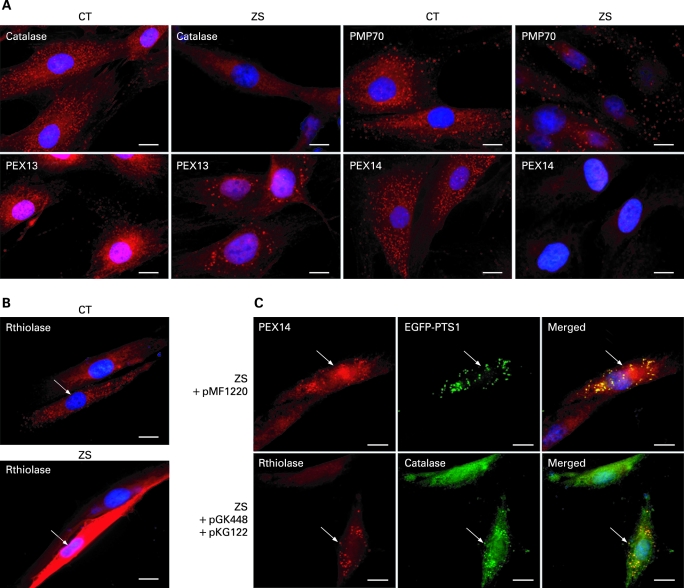
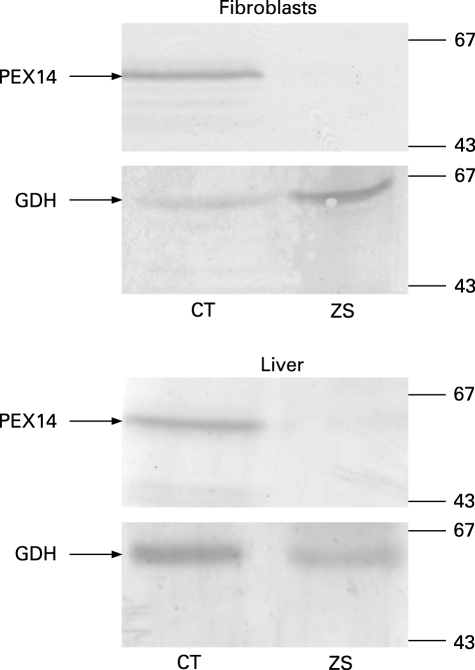
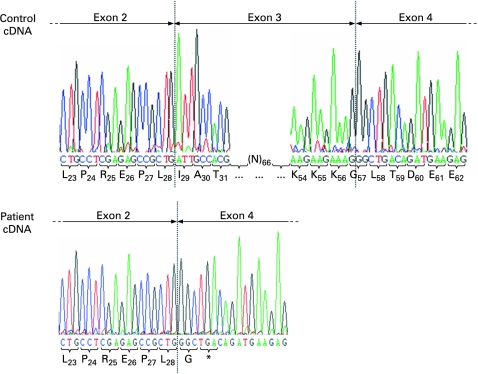
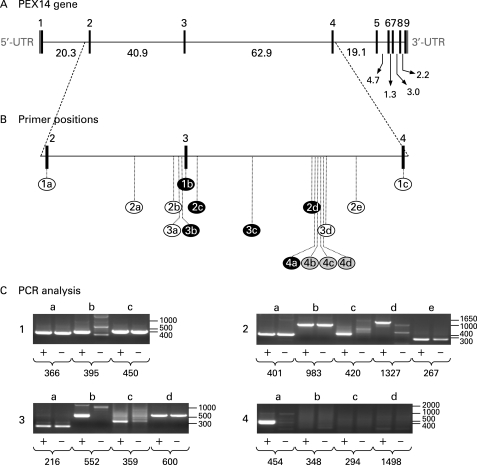
Here we report a patient with Zellweger syndrome, who presented at the age of 3 months with icterus, dystrophy, axial hypotonia, and hepatomegaly. Abnormal findings of metabolic screening tests included hyperbilirubinaemia, hypoketotic dicarboxylic aciduria, increased C(26:0) and decreased C(22:0) plasma levels, and strongly reduced plasmalogen concentrations. In fibroblasts, both peroxisomal α- and β-oxidation were impaired. Liver histology revealed bile duct paucity, cholestasis, arterial hyperplasia, very small branches of the vena portae, and parenchymatic destruction. Immunocytochemical analysis of cultured fibroblasts demonstrated that the cells contain peroxisomal remnants lacking apparent matrix protein content and PEX14, a central membrane component of the peroxisomal matrix protein import machinery. Transfection of fibroblasts with a plasmid coding for wild-type PEX14 restored peroxisomal matrix protein import. Mutational analysis of this gene revealed a genomic deletion leading to the deletion of exon 3 from the coding DNA (c.85-?_170+?del) and a concomitant change of the reading frame (p.[Ile29_Lys56del;Gly57GlyfsX2]).


Figures

Figure 1
Figure 1. Facial profile, liver ultrastructure, and magnetic resonance imaging (MRI) brain scan of the patient.
(A) Lateral view of the patient’s head at the age of 20 months, showing slight megalocephaly and low implanted ears. (B) Electron microscopy of the liver showing severe parenchymatic destruction and cholestasis (dilated cholestatic bile canaliculi: arrows). (C) In the cytoplasm of most hepatocytes, peroxisomes were absent; only abnormal small bodies resembling incompletely developed peroxisomes or peroxisomal ghosts (arrow) are observed. (D) Rare areas with fibrillar material (arrow) are seen in the hyaloplasm of some hepatocytes. (E) Polymicrogyria is seen in the right frontal and parietal cortex and in the left rolandic cortex (arrows). (F) Bilateral symmetrical laminar heterotopia is seen as a thin line of grey matter between the ventricle and the cortex in the frontal and parietal lobe (arrows).
Figure 2
Figure 2. Immunocytochemical localisation of peroxisomal proteins in patient and control fibroblasts.
(A) Control (CT) and Zellweger patient (ZS) fibroblasts were processed for immunostaining with antibodies specific for catalase, PEX13, PMP70, or PEX14 (red). (B) As we experienced difficulty detecting endogenous thiolase in human skin fibroblasts, the cells were transfected with a plasmid coding for rat thiolase B (rthiolase) 2 days before immunostaining with anti-thiolase B antibodies. (C) Cultured patient fibroblasts were (co)transfected with pMF1220, a bicistronic plasmid encoding non-tagged human PEX14 and EGFP-PTS1, or pGK448 and pKG122, two monocistronic plasmids encoding non-tagged human PEX14 and rat thiolase B, respectively; after 2 days, the cells were processed for fluorescence microscopy using rabbit anti-PEX14 antibodies (upper row) or rabbit anti-thiolase B (red) and mouse anti-catalase (green) antibodies (lower row); note that catalase and EGFP-PTS1, two PTS1-containing proteins, as well as thiolase B, a PTS2-containing protein, display a punctate staining pattern indicating the reconstitution of functional peroxisomes. The nuclei were counterstained with DAPI (blue), and transfected cells are marked by arrows. Scale bar: 20 μm.
Figure 3
Figure 3. Immunoblot analysis of PEX14 in patient and control fibroblasts.
Equal amounts of total protein extracted from cultured skin fibroblasts (two upper panels) or liver (two lower panels) from a control (CT) or the Zellweger patient (ZS) were subjected to SDS-PAGE and transferred to nitrocellulose. The membranes were then probed with antisera raised against PEX14 and GDH (loading control). The migration of relevant molecular mass markers (expressed in kDa) is indicated.
Figure 4
Figure 4. Automated sequence chromatogram of the 5′- and 3′-flanking region of exon 3 from control and patient cDNA.
The deduced amino acids (one-letter code) are presented below the nucleotide sequences. The subscript numbers refer to the position of the amino acid in the wild-type protein. Note that a deletion of exon 3 in the patient’s cDNA results in a reading frame shift leading to a premature stop codon (*) in exon 4.
Figure 5
Figure 5. Mutation analysis of the PEX14 gene.
(A) Genomic organisation of the human PEX14 gene with schematic representations of the exon-intron structures (adapted from Krona et al12). Black boxes represent the coding regions, and grey boxes represent the 5′- and 3′-untranslated regions (UTRs) of the gene. The intron sizes are indicated in kilobase pairs. (B) Schematic representation of the nested PCR strategy. Each circled number represents a nested PCR reaction carried out with the primer pair combinations listed in supplementary table 2: black characters on a white background indicate that a specific PCR product was obtained from both the control and the Zellweger patient’s genomic DNA; white characters on a black background indicate that a specific PCR product could only be obtained from the control patient’s genomic DNA; and black characters on a grey background indicate that no specific PCR products could be obtained. (C) DNA fragment analysis of the nested PCR reactions listed in panel B (+, control; –, patient). The numbers under each lane refer to the expected size (in bp) of each PCR product. The molecular mass markers (in bp) are also indicated.

Similar articles

Cited by

References

    1. Mannaerts GP, Van Veldhoven PP, Casteels M. Peroxisomal lipid degradation via beta- and alpha-oxidation in mammals. Cell Biochem Biophys 2003; 32: 73–87 - PubMed
    1. Wanders RJ, Waterham HR. Peroxisomal disorders: the single peroxisomal enzyme deficiencies. Biochim Biophys Acta 2006; 1763: 1707–20 - PubMed
    1. Shimozawa N. Molecular and clinical aspects of peroxisomal diseases. J Inherit Metab Dis 2007; 30: 193–7 - PubMed
    1. Steinberg SJ, Dodt G, Raymond GV, et al. Peroxisome biogenesis disorders. Biochim Biophys Acta 2006; 1763: 1733–48 - PubMed
    1. Goldfischer S, Moore CL, Johnson AB, et al. Peroxisomal and mitochondrial defects in the cerebro-hepato-renal syndrome. Science 1973; 182: 62–4 - PubMed

LinkOut - more resources