

Medical cost trajectories and onsets of cancer and noncancer diseases in US elderly population
- PMID: 21687557
- PMCID: PMC3115464
- DOI: 10.1155/2011/857892
Medical cost trajectories and onsets of cancer and noncancer diseases in US elderly population
Abstract
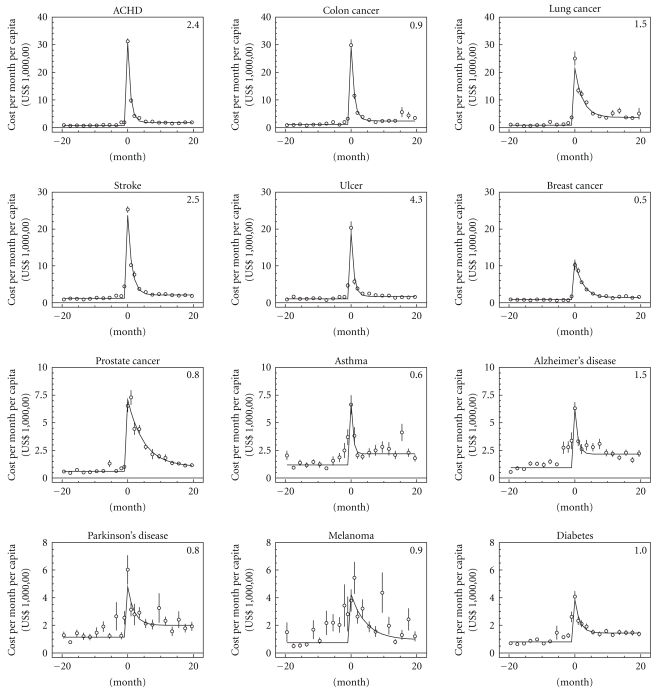
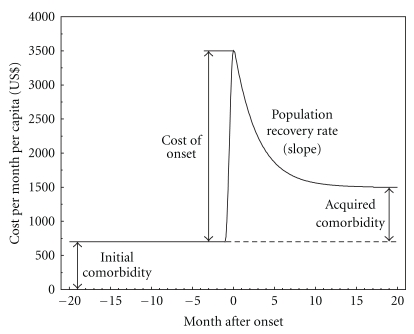
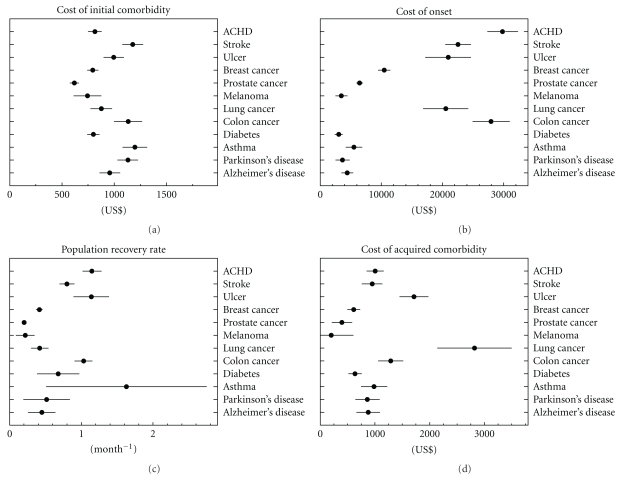
Time trajectories of medical costs-associated with onset of twelve aging-related cancer and chronic noncancer diseases were analyzed using the National Long-Term Care Survey data linked to Medicare Service Use files. A special procedure for selecting individuals with onset of each disease was developed and used for identification of the date at disease onset. Medical cost trajectories were found to be represented by a parametric model with four easily interpretable parameters reflecting: (i) prediagnosis cost (associated with initial comorbidity), (ii) cost of the disease onset, (iii) population recovery representing reduction of the medical expenses associated with a disease since diagnosis was made, and (iv) acquired comorbidity representing the difference between post- and pre diagnosis medical cost levels. These parameters were evaluated for the entire US population as well as for the subpopulation conditional on age, disability and comorbidity states, and survival (2.5 years after the date of onset). The developed approach results in a family of new forecasting models with covariates.
Figures
References
-
- HI, SMI. Annual Report of the Boards of Trustees of the Federal Hospital Insurance and Federal Supplementary Medical Insurance Trust Funds. Washington, DC, USA, 2010, https://www.cms.gov/ReportsTrustFunds/downloads/tr2010.pdf.
-
- HI, SMI. Annual Report of the Boards of Trustees of the Federal Hospital Insurance and Federal Supplementary Medical Insurance Trust Funds. Washington, DC, USA, 2009, http://www.cms.gov/ReportsTrustFunds/downloads/tr2009.pdf.
-
- Klees BS, et al. Brief summaries of Medicare and Medicaid. Health Care Financing Review/2009 Statistical Supplement, November 2009.
-
- Goldman DP. Final Reports. Santa Monica, Calif, USA: Rand Corporation, RAND; 2004. Health status and medical treatment of the future elderly.
-
- Pardes H, Manton KC, Lander ES, Tolley HD, Ulllan AD, Palmer H. Effects of medical research on health care and the economy. Science. 1999;283(5398):36–37. - PubMed
Publication types
MeSH terms
Grants and funding
LinkOut - more resources
Full Text Sources
Medical
