. 2011:2011:158970.
doi: 10.1155/2011/158970. Epub 2011 Apr 20.

ELAN: a software package for analysis and visualization of MEG, EEG, and LFP signals

Affiliations

ELAN: a software package for analysis and visualization of MEG, EEG, and LFP signals

Pierre-Emmanuel Aguera et al. Comput Intell Neurosci. 2011.

Abstract

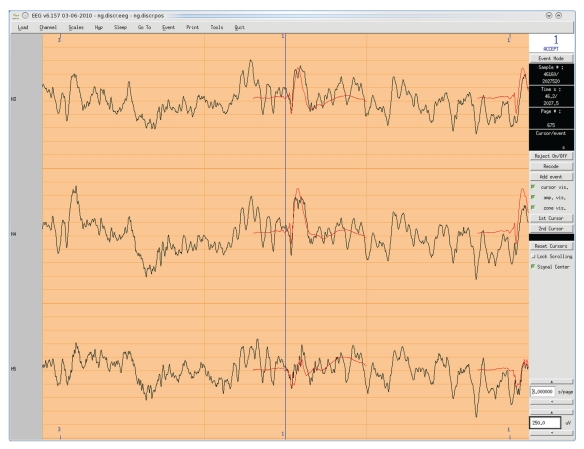
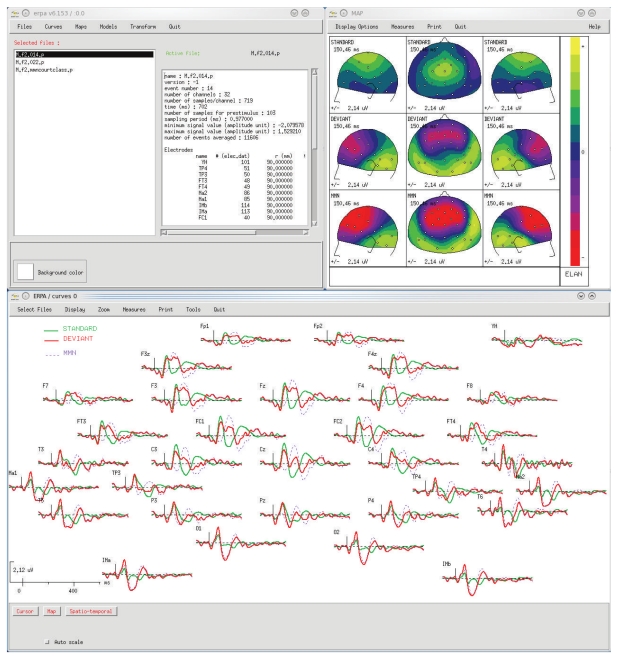
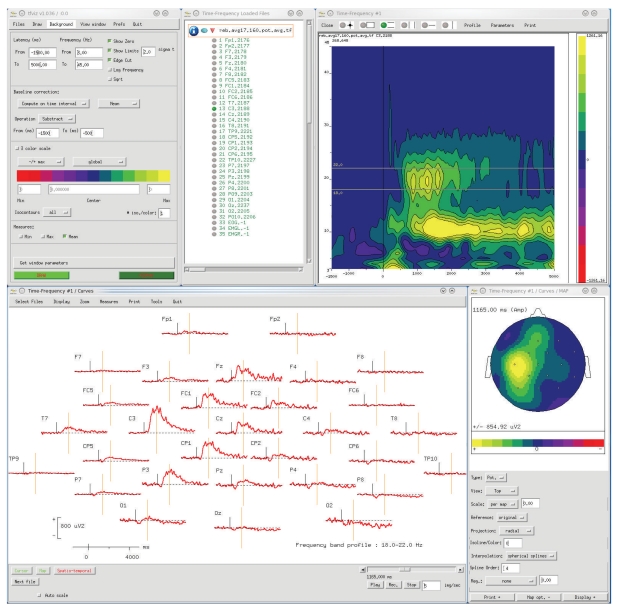
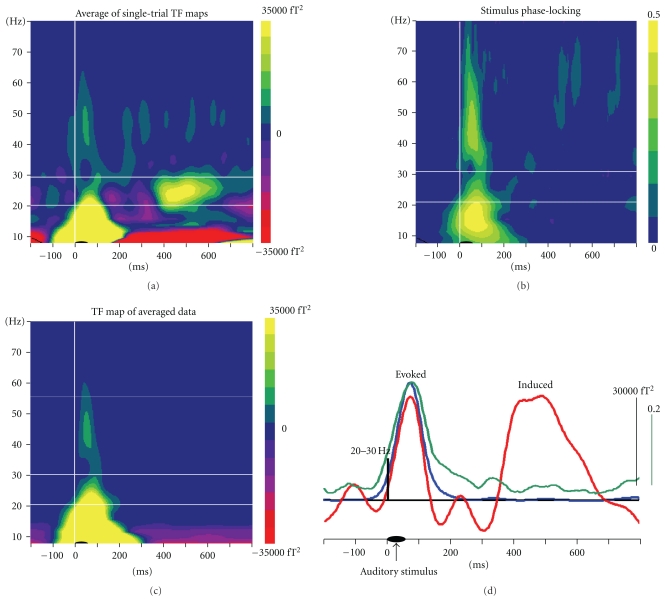
The recent surge in computational power has led to extensive methodological developments and advanced signal processing techniques that play a pivotal role in neuroscience. In particular, the field of brain signal analysis has witnessed a strong trend towards multidimensional analysis of large data sets, for example, single-trial time-frequency analysis of high spatiotemporal resolution recordings. Here, we describe the freely available ELAN software package which provides a wide range of signal analysis tools for electrophysiological data including scalp electroencephalography (EEG), magnetoencephalography (MEG), intracranial EEG, and local field potentials (LFPs). The ELAN toolbox is based on 25 years of methodological developments at the Brain Dynamics and Cognition Laboratory in Lyon and was used in many papers including the very first studies of time-frequency analysis of EEG data exploring evoked and induced oscillatory activities in humans. This paper provides an overview of the concepts and functionalities of ELAN, highlights its specificities, and describes its complementarity and interoperability with other toolboxes.


Figures

Figure 1
Figure 1
EEG vizualisation tool for continuous data (.eeg file), with an example of intracranial auditory EEG signals. X-axis: time, Y-axis: signal amplitude, one row per channel. Events are displayed above and below the continuous EEG signals, and the averaged event-related response is superimposed in red. Various plotting tools and online analysis functions are available through the menus (top and right of the window).
Figure 2
Figure 2
ERPA visualization tool for averaged signals (.p file), with an example of scalp auditory ERPs (MMN protocol). Top left window: main ERPA window to select files and launch visualization tools. Bottom: time courses of event-related responses (positivity is up). Top right: mapping of event-related responses, here with several views of three different ERPs at the same latency. In the windows where data are visualized, plotting functions and tools for on-the-fly signal processing or measurements are available through the menus at the top.
Figure 3
Figure 3
TFVIZ visualization tool for time-frequency data (.tf file), with an example of scalp EEG in a motor finger tapping protocol. Top left: main TFVIZ window, to select files, set vizualisation parameters, apply baseline correction, and so forth. Top center: window to select the channels to visualize. Top right: time-frequency plot, here for one channel in one TF file (X-axis: time, Y-axis: frequency, amplitude is color-coded). Bottom left: visualization of the time-course of signal amplitude in one frequency band defined by two cursors on the TF plot (this display offers the same functionalities as in ERPA, see Figure 2). Bottom right: topography for one frequency band at the latency defined by the cursor on the curves. This figure illustrates the possibility to navigate with TFVIZ in this multidimensional data set (in the frequency, time, and spatial dimensions).
Figure 4
Figure 4
Overview of ELAN analysis workflow, with an example of scalp auditory EEG data. Artifact rejection is done automatically or manually and visualized with EEG (top). Signal averaging is then performed within and across subjects (middle), with a possibility to filter the data. Topography (including SCDs) can then be assessed with ERPA (bottom left, example of auditory N1). Note that additional frontal current sinks are identified more easily with SCDs than with potential maps. Bottom right: statistical map obtained by comparing the amplitude of the responses in two conditions across subjects at the latency of the auditory N1 (adapted from [5]).
Figure 5
Figure 5
Time-Frequency analysis: dissociation of evoked and induced oscillatory activities, in an example of MEG responses to auditory stimuli. Top left: TF map obtained after averaging of wavelet transforms of single trials, which contains both evoked and induced responses. Top right: stimulus phase locking factor. For each single trial the phase of the response relative to an event (here the auditory stimulus) is computed, and the stability of the phase across trials is represented. Phase locking is close to 0 for activities not phase-locked to the stimulus also called induced activity, and larger stimulus phase locking values (up to 1) characterize stimulus phase-locked activities (evoked responses). Bottom left: TF map obtained after wavelet transform of the averaged evoked response, reflecting mostly evoked activities. Bottom right: time courses in the 20–30 Hz frequency band of the averaged oscillatory power (red), of evoked oscillatory power (blue), and of the stimulus phase-locking factor (green). The first peak of oscillatory responses at ~100 ms could be identified as evoked, whereas the second one around 500 ms is induced.
Figure 6
Figure 6
TF synchrony analysis, with an example of intracranial EEG activities after visual stimulation. Middle panels represent the TF power for two recording sites in the lateral occipital sulcus (left) and fusiform gyrus (right). Phase synchrony between the two sites was computed for each trial and averaged (bottom left). Significance of the synchrony values was assessed using randomization statistics (bottom right). Significant coupling was observed in the beta band (adapted from [6]).

Similar articles

Cited by

References

    1. Ravel N, Chabaud P, Martin C, et al. Olfactory learning modifies the expression of odour-induced oscillatory responses in the gamma (60–90 Hz) and beta (15–40 Hz) bands in the rat olfactory bulb. European Journal of Neuroscience. 2003;17(2):350–358. - PubMed
    1. Rols G, Tallon-Baudry C, Girard P, Bertrand O, Bullier J. Cortical mapping of gamma oscillations in areas V1 and V4 of the macaque monkey. Visual Neuroscience. 2001;18(4):527–540. - PubMed
    1. Delorme A, Makeig S. EEGLAB: an open source toolbox for analysis of single-trial EEG dynamics including independent component analysis. Journal of Neuroscience Methods. 2004;134(1):9–21. - PubMed
    1. Ruby P, Caclin A, Boulet S, Delpuech C, Morlet D. Odd sound processing in the sleeping brain. Journal of Cognitive Neuroscience. 2008;20(2):296–311. - PubMed
    1. Caclin A, McAdams S, Smith BK, Giard MH. Interactive processing of timbre dimensions: an exploration with event-related potentials. Journal of Cognitive Neuroscience. 2008;20(1):49–64. - PubMed

LinkOut - more resources