

Mapping the risk of anaemia in preschool-age children: the contribution of malnutrition, malaria, and helminth infections in West Africa
- PMID: 21687688
- PMCID: PMC3110251
- DOI: 10.1371/journal.pmed.1000438
Mapping the risk of anaemia in preschool-age children: the contribution of malnutrition, malaria, and helminth infections in West Africa
Abstract
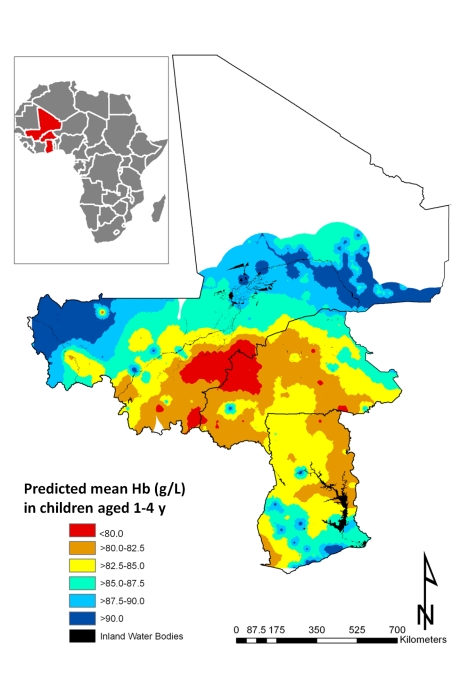
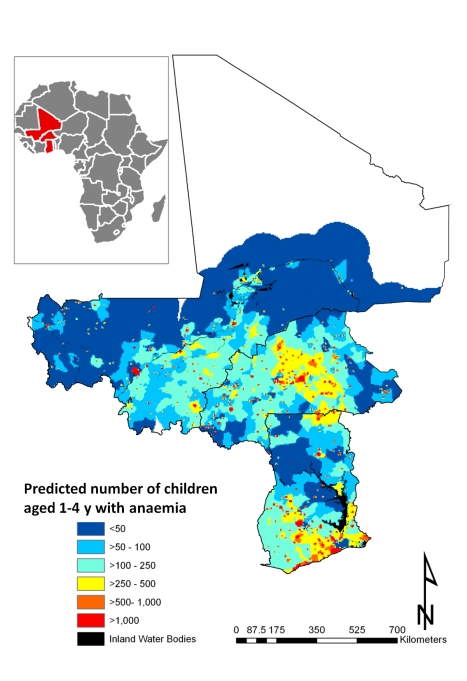
Background: Childhood anaemia is considered a severe public health problem in most countries of sub-Saharan Africa. We investigated the geographical distribution of prevalence of anaemia and mean haemoglobin concentration (Hb) in children aged 1-4 y (preschool children) in West Africa. The aim was to estimate the geographical risk profile of anaemia accounting for malnutrition, malaria, and helminth infections, the risk of anaemia attributable to these factors, and the number of anaemia cases in preschool children for 2011.
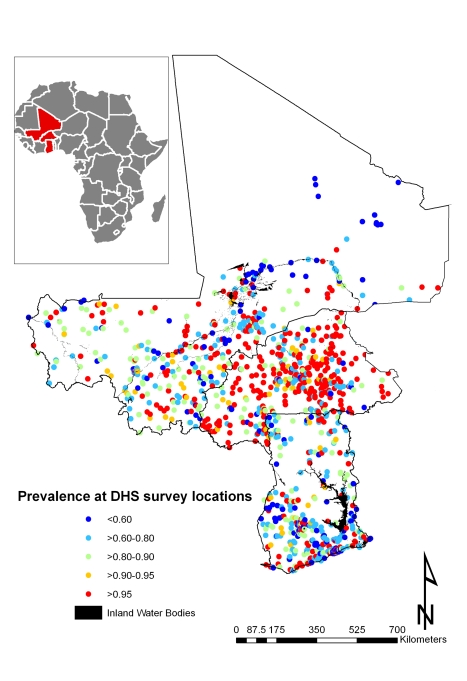
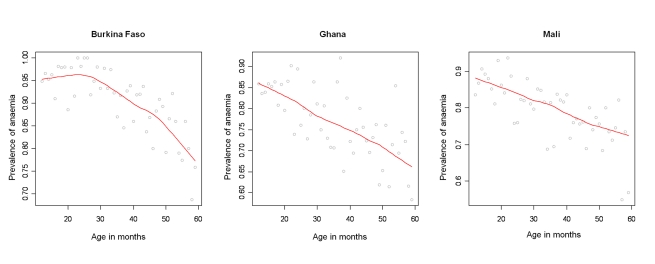
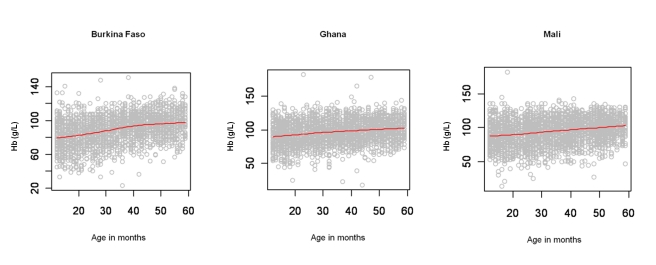
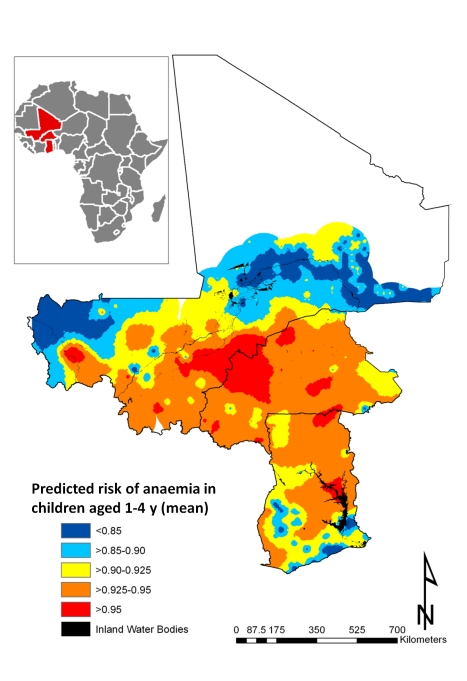
Methods and findings: National cross-sectional household-based demographic health surveys were conducted in 7,147 children aged 1-4 y in Burkina Faso, Ghana, and Mali in 2003-2006. Bayesian geostatistical models were developed to predict the geographical distribution of mean Hb and anaemia risk, adjusting for the nutritional status of preschool children, the location of their residence, predicted Plasmodium falciparum parasite rate in the 2- to 10-y age group (Pf PR(2-10)), and predicted prevalence of Schistosoma haematobium and hookworm infections. In the four countries, prevalence of mild, moderate, and severe anaemia was 21%, 66%, and 13% in Burkina Faso; 28%, 65%, and 7% in Ghana, and 26%, 62%, and 12% in Mali. The mean Hb was lowest in Burkina Faso (89 g/l), in males (93 g/l), and for children 1-2 y (88 g/l). In West Africa, severe malnutrition, Pf PR(2-10), and biological synergisms between S. haematobium and hookworm infections were significantly associated with anaemia risk; an estimated 36.8%, 14.9%, 3.7%, 4.2%, and 0.9% of anaemia cases could be averted by treating malnutrition, malaria, S. haematobium infections, hookworm infections, and S. haematobium/hookworm coinfections, respectively. A large spatial cluster of low mean Hb (<80 g/l) and maximal risk of anaemia (>95%) was predicted for an area shared by Burkina Faso and Mali. We estimate that in 2011, approximately 6.7 million children aged 1-4 y are anaemic in the three study countries.
Conclusions: By mapping the distribution of anaemia risk in preschool children adjusted for malnutrition and parasitic infections, we provide a means to identify the geographical limits of anaemia burden and the contribution that malnutrition and parasites make to anaemia. Spatial targeting of ancillary micronutrient supplementation and control of other anaemia causes, such as malaria and helminth infection, can contribute to efficiently reducing the burden of anaemia in preschool children in Africa.
Conflict of interest statement
The authors have declared that no competing interests exist.
Figures
Comment in
-
The first model-based geostatistical map of anaemia.PLoS Med. 2011 Jun;8(6):e1001039. doi: 10.1371/journal.pmed.1001039. Epub 2011 Jun 7. PLoS Med. 2011. PMID: 21687687 Free PMC article.
References
-
- World Health Organization. Geneva: World Health Organization.; 2008. Worldwide prevalence of anaemia 1993–2005: WHO global database on anaemia. Available: http://whqlibdoc.who.int/publications/2008/9789241596657_eng.pdf. Accessed 25 April 2011.
-
- Grantham-McGregor S, Ani C. A review of studies on the effect of iron deficiency on cognitive development in children. J Nutr. 2001;131:649S–666S; discussion 666S-668S. - PubMed
-
- Lawless JW, Latham MC, Stephenson LS, Kinoti SN, Pertet AM. Iron supplementation improves appetite and growth in anemic Kenyan primary school children. J Nutr. 1994;124:645–654. - PubMed
-
- Oppenheimer SJ. Iron and its relation to immunity and infectious disease. J Nutr. 2001;131:616S–633S; discussion 633S-635S. - PubMed
-
- Morris CR, Singer ST, Walters MC. Clinical hemoglobinopathies: iron, lungs and new blood. Curr Opin Hematol. 2006;13:407–418. - PubMed
Publication types
MeSH terms
Substances
LinkOut - more resources
Full Text Sources
Medical
Research Materials
