. 2011;6(6):e19788.
doi: 10.1371/journal.pone.0019788. Epub 2011 Jun 8.

Extreme conservation leads to recovery of the Virunga mountain gorillas

Affiliations

Extreme conservation leads to recovery of the Virunga mountain gorillas

Martha M Robbins et al. PLoS One. 2011.

Abstract

As wildlife populations are declining, conservationists are under increasing pressure to measure the effectiveness of different management strategies. Conventional conservation measures such as law enforcement and community development projects are typically designed to minimize negative human influences upon a species and its ecosystem. In contrast, we define "extreme" conservation as efforts targeted to deliberately increase positive human influences, including veterinary care and close monitoring of individual animals. Here we compare the impact of both conservation approaches upon the population growth rate of the critically endangered Virunga mountain gorillas (Gorilla beringei beringei), which increased by 50% since their nadir in 1981, from approximately 250 to nearly 400 gorillas. Using demographic data from 1967-2008, we show an annual decline of 0.7%±0.059% for unhabituated gorillas that received intensive levels of conventional conservation approaches, versus an increase 4.1%±0.088% for habituated gorillas that also received extreme conservation measures. Each group of habituated gorillas is now continuously guarded by a separate team of field staff during daylight hours and receives veterinary treatment for snares, respiratory disease, and other life-threatening conditions. These results suggest that conventional conservation efforts prevented a severe decline of the overall population, but additional extreme measures were needed to achieve positive growth. Demographic stochasticity and socioecological factors had minimal impact on variability in the growth rates. Veterinary interventions could account for up to 40% of the difference in growth rates between habituated versus unhabituated gorillas, with the remaining difference likely arising from greater protection against poachers. Thus, by increasing protection and facilitating veterinary treatment, the daily monitoring of each habituated group contributed to most of the difference in growth rates. Our results argue for wider consideration of extreme measures and offer a startling view of the enormous resources that may be needed to conserve some endangered species.


Conflict of interest statement

Competing Interests: One author is affiliated with Zoo Atlanta. Zoo Atlanta is a non-profit 501(c) 3 and therefore there are no competing interests. The authors have declared that no competing interests exist.

Figures

Figure 1
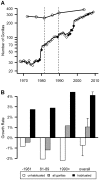
Figure 1. Temporal variations in the population size and growth rate.
a. Size of the total population (circles) and the habituated groups (diamonds) throughout the study. Filled diamonds indicate years when additional groups were habituated. Solid lines show the results from the time series analyses for the intervals before the 1972 census, between each pair of consecutive censuses, and after the 2003 census. Dashed vertical lines show the three broader time intervals used in Figure 1b. The overall population density equals the total population size divided by the park area (450 km2). b. Time series analyses for the growth rates of the habituated groups, unhabituated groups, and the total population before the 1981 census, after the 1989 census, and during the interval in between. Error bars for the overall growth rates indicate the standard error among the five intervals between consecutive censuses.
Figure 2
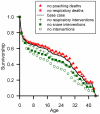
Figure 2. Survivorship curves used in Leslie matrix models for the growth rate of habituated groups.
Listed from top to bottom, the cases show survivorship without poaching deaths (red triangles), without respiratory deaths (red asterisks), the base case (i.e., the complete dataset, black line), without veterinary interventions for respiratory disease (green plus marks), without interventions for snare wounds (green squares), and without any veterinary interventions (green circles). These values represent the modeling with 100% mortality in the absence of the veterinary interventions; assuming lower mortality would move the lines closer to the base case model.
Figure 3
Figure 3. Distribution of the Virunga mountain gorilla groups in the 2003 census, and satellite mapping of vegetation zones throughout their habitat.
The sizes of the circles and triangles indicate the total number of gorillas in each habituated and unhabituated group . The dry weight biomass of foods consumed by gorillas was 74.3 g/m2 for hagenia and herbaceous zones, 4.2 g/m2 for bamboo, 15.4 g/m2 for brush ridge, 19.3 g/m2 for mixed forest, 18.8 g/m2 for mimulopsis, and 25.0 g/m2 for subalpine zones . The alpine and water zones are not gorilla habitats.
Figure 4
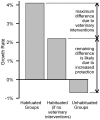
Figure 4. Time series analyses of growth rates under different management regimes.
The first bar shows the growth rate for habituated groups, which received both continuous monitoring and veterinary treatment. The second bar estimates what the growth rate would have been for habituated groups, if they had been monitored continuously but did not receive veterinary care, and all afflicted gorillas had died instead. The difference between the first bar and second bar represents the maximum potential impact of veterinary interventions on the habituated gorillas (assumption of 100% mortality without interventions). The third bar shows growth rate for the unhabituated groups, which did not receive either continuous monitoring or veterinary treatment. The difference between the second bar and third bar shows what the impact of continuous monitoring could have been without veterinary interventions. Most of this difference was likely to arise from increased protection against poachers.

References

    1. Kapos V, Balmford A, Aveling R, Bubb P, Carey P, et al. Calibrating conservation: new tools for measuring success. Conservation Letters. 2008;1:155–164.
    1. Ferraro PJ, Pattanayak SK. Money for nothing? A call for empirical evaluation of biodiversity conservation investments. Plos Biology. 2006;4:482–488. - PMC - PubMed
    1. Bruner AG, Gullison RE, Balmford A. Financial costs and shortfalls of managing and expanding protected-area systems in developing countries. Bioscience. 2004;54:1119–1126.
    1. Struhsaker TT, Struhsaker PJ, Siex KS. Conserving Africa's rain forests: problems in protected areas and possible solutions. Biological Conservation. 2005;123:45–54.
    1. Nichols JD, Williams BK. Monitoring for conservation. Trends in Ecology & Evolution. 2006;21:668–673. - PubMed

Publication types