. 2011;6(6):e20656.
doi: 10.1371/journal.pone.0020656. Epub 2011 Jun 7.

Temporal analysis of the honey bee microbiome reveals four novel viruses and seasonal prevalence of known viruses, Nosema, and Crithidia

Affiliations

Temporal analysis of the honey bee microbiome reveals four novel viruses and seasonal prevalence of known viruses, Nosema, and Crithidia

Charles Runckel et al. PLoS One. 2011.

Abstract

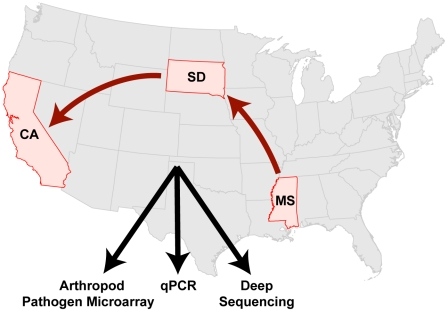
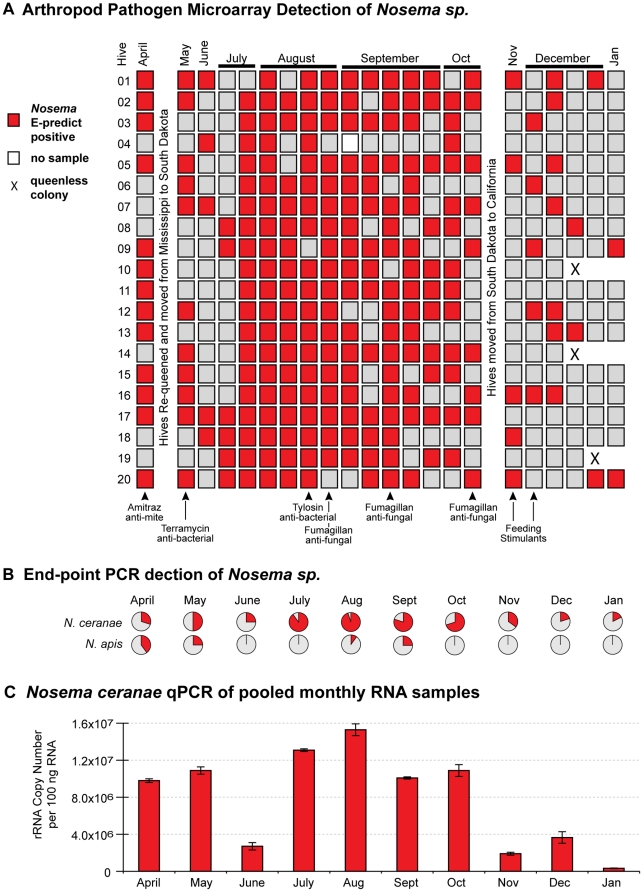
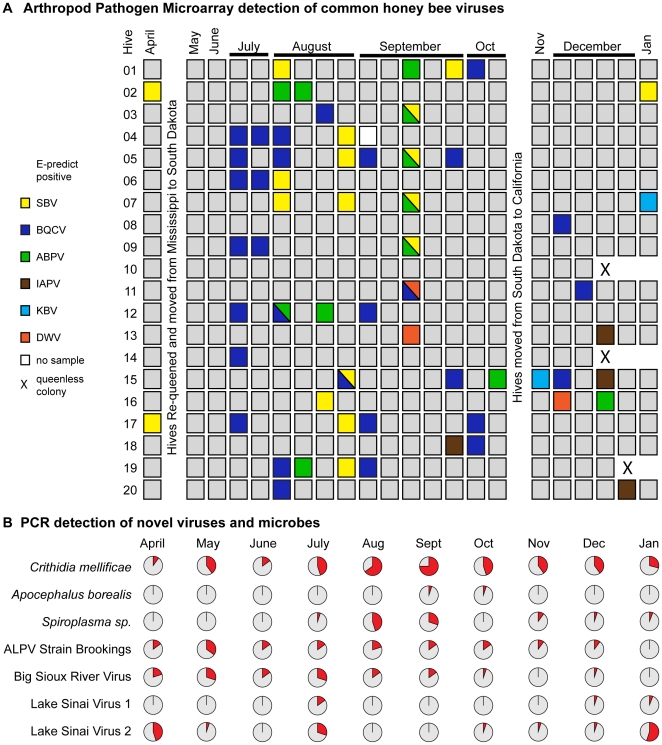
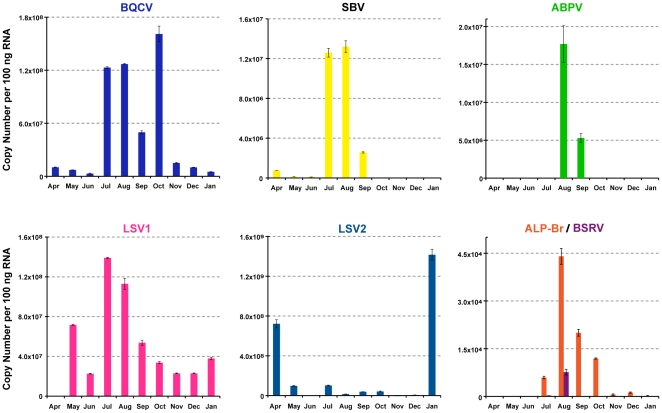
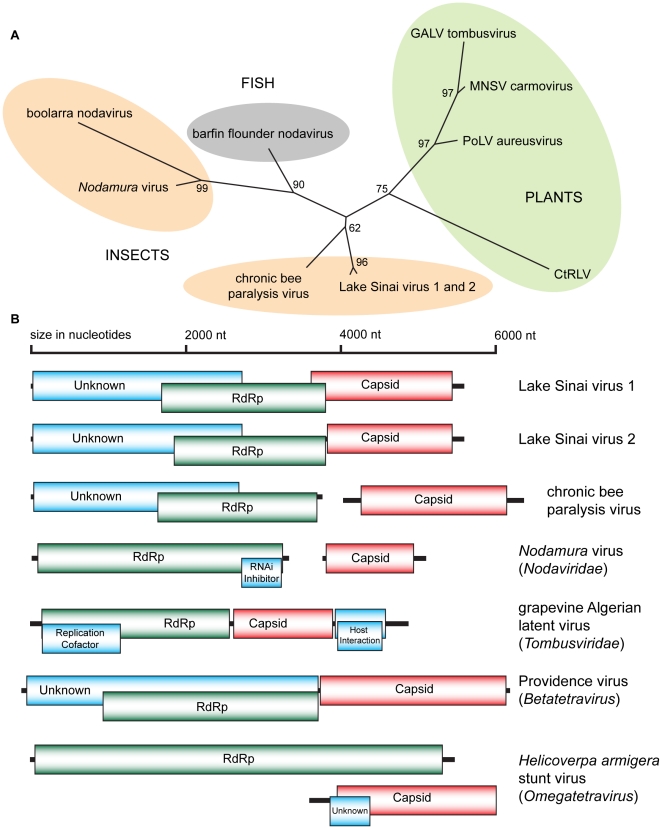
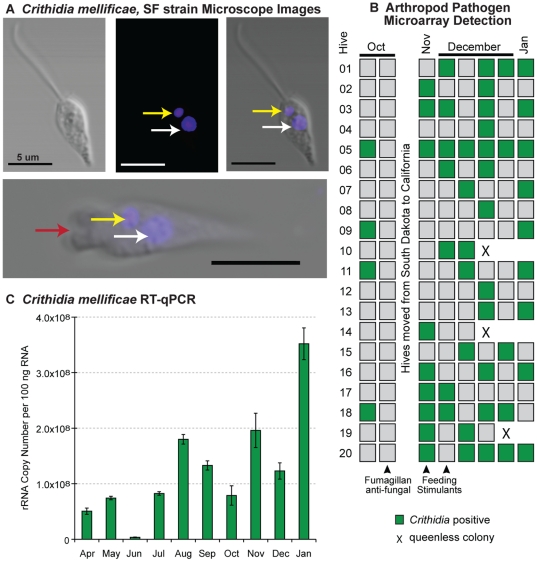
Honey bees (Apis mellifera) play a critical role in global food production as pollinators of numerous crops. Recently, honey bee populations in the United States, Canada, and Europe have suffered an unexplained increase in annual losses due to a phenomenon known as Colony Collapse Disorder (CCD). Epidemiological analysis of CCD is confounded by a relative dearth of bee pathogen field studies. To identify what constitutes an abnormal pathophysiological condition in a honey bee colony, it is critical to have characterized the spectrum of exogenous infectious agents in healthy hives over time. We conducted a prospective study of a large scale migratory bee keeping operation using high-frequency sampling paired with comprehensive molecular detection methods, including a custom microarray, qPCR, and ultra deep sequencing. We established seasonal incidence and abundance of known viruses, Nosema sp., Crithidia mellificae, and bacteria. Ultra deep sequence analysis further identified four novel RNA viruses, two of which were the most abundant observed components of the honey bee microbiome (∼10(11) viruses per honey bee). Our results demonstrate episodic viral incidence and distinct pathogen patterns between summer and winter time-points. Peak infection of common honey bee viruses and Nosema occurred in the summer, whereas levels of the trypanosomatid Crithidia mellificae and Lake Sinai virus 2, a novel virus, peaked in January.


Conflict of interest statement

Competing Interests: The authors have declared that no competing interests exist.

Figures

Figure 1
Figure 1. Temporal monitoring of the honey bee microbiome from 20 monitor colonies within a large-scale migratory U.S. beekeeping operation using a custom arthropod pathogen microarray, PCR, quantitative PCR, and ultra deep sequencing.
The colonies were established with new queens in Mississippi (MS) in April 2009, moved to South Dakota (SD) in May 2009, and finally to California (CA) in November 2009; monitoring concluded in January 2010.
Figure 2
Figure 2. Nosema detection and quantification in time-course samples from 20 honey bee colonies.
(A) Arthropod pathogen microarray detection of Nosema sp. in each colony (5 bees per sample) throughout the 10-month time-course. Colonies were managed using standard commercial beekeeping practices and treatments, which are listed below panel A and further described in Materials and Methods. (B) Nosema ceranae and Nosema apis incidence assessed by species-specific end-point PCR from a single time-point (n = 20) each month; the positive sample percentages in each pie-chart are indicated in red. (C) Relative abundance of Nosema ceranae throughout the time-course assessed by qPCR of pooled monthly RNA samples; quantification of rRNA copy number based on a standard curve as described in Materials and Methods.
Figure 3
Figure 3. Detection of viruses and microbes in time-course samples from 20 honey bee colonies.
(A) Arthropod pathogen microarray detection of viruses: sacbrood virus (SBV), black queen cell virus (BQCV), acute bee paralysis virus (ABPV), Israeli acute bee paralysis virus (IAPV), Kashmir bee virus (KBV), deformed virus (DWV) in each colony (5 bees per sample). (B) Incidence of select parasites assessed by end-point PCR from a single time-point each month (each chart n = 20, except January n = 17); the positive sample percentages in each pie-chart are indicated in red.
Figure 4
Figure 4. Relative abundance of select viruses assessed by RT-qPCR of pooled monthly time-course samples.
Viral genome copy numbers per 100 ng RNA were calculated based on standard curves [(black queen cell virus (BQCV), sacbrood virus (SBV), acute bee paralysis virus (ABPV), Lake Sinai virus strain 1 (LSV1), Lake Sinai virus strain 2 (LSV2), aphid lethal paralysis virus strain Brookings (ALP-Br), and Big Sioux River virus (BSRV)]; multiplying reported values by 500 provides a copy number per bee estimate, as further described in Materials and Methods. LSV2, a novel virus, reached the highest copy number observed in this study in January 2010 (1.42×10⁹ copies per 100 ng of RNA sample; approximately 7.1×10¹¹ copies per bee); note the y-axes on each graph are independently scaled.
Figure 5
Figure 5. Phylogenetic placement and genome organization of Lake Sinai viruses.
(A) RdRp amino acid phylogeny of the Nodavirales superfamily. Lake Sinai virus strain 1 (LSV1; HQ871931), Lake Sinai virus strain 2 (LSV2: HQ888865), chronic bee paralysis virus (CBPV; NC010711), boolarra virus (BoV; NC004142), Nodamura virus (NoV; NC002690), barfin flounder nodavirus BF93Hok (BFV; NC011063), grapevine Algerian latent virus (GALV; NC011535), melon necrotic spot virus (MNSV; NC001504), pothos latent virus (PoLV; NC000939) and carrot red leaf virus (CtRLV; NC006265). Protein sequences were aligned by ClustalW and a tree generated by the Neighbor-Joining method with 100 replicates (B) Genome organization of the Lake Sinai viruses and similar RNA viruses.
Figure 6
Figure 6. Crithidia mellificae, SF strain detection and quantification.
(A) Light and fluorescent microscope images illustrate key features of this trypanosomatid parasite including DAPI stained kinetoplast DNA (yellow arrow) and nuclear DNA (white arrow), as well as the flagellar pocket (bottom panel, red arrow); scale bar = 5 µm. (B) Arthropod pathogen microarray detection of Crithidia mellificae in each colony (5 bees per sample) from October 2009 to January 2010. (C) Relative abundance of Crithidia mellificae throughout the time-course as assessed by RT-qPCR of pooled monthly time-course samples; quantification of rRNA copy number based on a standard curve as described in Materials and Methods.

Similar articles

Cited by

References

    1. Pennisi E. Genetics - Honey bee genome illuminates insect evolution and social behavior. Science. 2006;314:578–579. - PubMed
    1. Winston ML. 1987. The biology of the Honey Bee: First Harvard Press.
    1. Johnson R. 2010. Honey Bee Colony Collapse Disorder.
    1. USDA-ARS Questions and Answers: Colony Collapse Disorder
    1. Morse RA, Calderone NW. The Value of Honey Bees as Pollinators of U.S. Crops in 2000. Gleanings in Bee Culture Supple. 2000:1–15.

Publication types