. 2011 Sep-Oct;17(9-10):1056-64.
doi: 10.2119/molmed.2011.00141. Epub 2011 Jun 14.

Adipocyte enhancer-binding protein 1 (AEBP1) (a novel macrophage proinflammatory mediator) overexpression promotes and ablation attenuates atherosclerosis in ApoE (-/-) and LDLR (-/-) mice

Affiliations

Adipocyte enhancer-binding protein 1 (AEBP1) (a novel macrophage proinflammatory mediator) overexpression promotes and ablation attenuates atherosclerosis in ApoE (-/-) and LDLR (-/-) mice

Oleg Bogachev et al. Mol Med. 2011 Sep-Oct.

Abstract

Atherogenesis is a long-term process that involves inflammatory response coupled with metabolic dysfunction. Foam cell formation and macrophage inflammatory response are two key events in atherogenesis. Adipocyte enhancer-binding protein 1 (AEBP1) has been shown to impede macrophage cholesterol efflux, promoting foam cell formation, via peroxisome proliferator-activated receptor (PPAR)-γ1 and liver X receptor α (LXRα) downregulation. Moreover, AEBP1 has been shown to promote macrophage inflammatory responsiveness by inducing nuclear factor (NF)-κB activity via IκBα downregulation. Lipopolysaccharide (LPS)-induced suppression of pivotal macrophage cholesterol efflux mediators, leading to foam cell formation, has been shown to be mediated by AEBP1. Herein, we showed that AEBP1-transgenic mice (AEBP1(TG)) with macrophage-specific AEBP1 overexpression exhibit hyperlipidemia and develop atherosclerotic lesions in their proximal aortas. Consistently, ablation of AEBP1 results in significant attenuation of atherosclerosis (males: 3.2-fold, P = 0.001 [en face]), 2.7-fold, P = 0.0004 [aortic roots]; females: 2.1-fold, P = 0.0026 [en face], 1.7-fold, P = 0.0126 [aortic roots]) in the AEBP1(-/-)/low-density lipoprotein receptor (LDLR )(-/-) double-knockout (KO) mice. Bone marrow (BM) transplantation experiments further revealed that LDLR (-/-) mice reconstituted with AEBP1(-/-)/LDLR (-/-) BM cells (LDLR (-/-)/KO-BM chimera) display significant reduction of atherosclerosis lesions (en face: 2.0-fold, P = 0.0268; aortic roots: 1.7-fold, P = 0.05) compared with control mice reconstituted with AEBP1(+/+)/LDLR (-/-) BM cells (LDLR (-/-)/WT-BM chimera). Furthermore, transplantation of AEBP1(TG) BM cells with the normal apolipoprotein E (ApoE) gene into ApoE (-/-) mice (ApoE (-/-)/TG-BM chimera) leads to significant development of atherosclerosis (males: 2.5-fold, P = 0.0001 [en face], 4.7-fold, P = 0.0001 [aortic roots]; females: 1.8-fold, P = 0.0001 [en face], 3.0-fold, P = 0.0001 [aortic roots]) despite the restoration of ApoE expression. Macrophages from ApoE (-/-)/TG-BM chimeric mice express reduced levels of PPARγ1, LXRα, ATP-binding cassette A1 (ABCA1) and ATP-binding cassette G1 (ABCG1) and increased levels of the inflammatory mediators interleukin (IL)-6 and tumor necrosis factor (TNF)-α compared with macrophages of control chimeric mice (ApoE (-/-)/NT-BM ) that received AEBP1 nontransgenic (AEBP1(NT) ) BM cells. Our in vivo experimental data strongly suggest that macrophage AEBP1 plays critical regulatory roles in atherogenesis, and it may serve as a potential therapeutic target for the prevention or treatment of atherosclerosis.


Figures
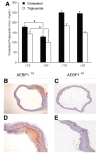
Figure 1
Figure 1
AEBP1 promotes diet-induced hyperlipidemia and atherosclerosis in mice. (A) Whole blood samples were obtained from 32-wk-old, HFD-fed AEBP1TG and AEBP1NT mice to measure total cholesterol and triglyceride serum levels by gas chromatograph. Concentration (Conc.) of total cholesterol and triglycerides is expressed as mg/dL, and data are demonstrated as mean ± SEM (n = 3–5). Statistical significance was determined relative to cholesterol or triglyceride serum level in AEBP1NT mice for each gender. To assess lipid-filled lesion formation, aortic cryosections obtained from 12- and 32-wk-old, chow- and HFD-fed AEBP1TG and AEBP1NT mice were stained with ORO. Representative images of ORO-stained aortic cryosections from 32-wk-old, HFD-fed AEBP1TG (B, D) and AEBP1NT (C, E) females are shown at 100× (B, C) and 400× (D, E) magnification. A total of 3–35 mice per group were examined (refer to Table 1 for more details).
Figure 2
Figure 2
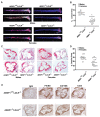
Ablation of AEBP1 attenuates atherosclerosis in LDLR-null mice. (A) En face staining of aortas of AEBP1+/+/LDLR −/− and AEBP1−/−/LDLR −/− male and female mice. Mice were fed an atherogenic diet for 13 wks, and aortic lesion was analyzed en face with sudan IV staining. (B) Graphs showing quantification of atherosclerotic lesion size as a percentage of total aortic area. Error bars represent SEM, **P ≤ 0.001 (n = 5 males, P = 0.001), *P ≤ 0.05 (n = 5 females, P = 0.0026). (C) Cross-sectional analysis at the aortic root of samples isolated from AEBP1+/+/LDLR −/− and AEBP1−/−/LDLR −/− mice. Representative ORO staining in the aortic sinus after 13 wks on the atherogenic diet. (D) Graphs showing quantification of atherosclerotic lesion size at the aortic sinus as a percentage of total aortic root area. Error bars represent SEM, **P ≤ 0.001 (n = 5 males, P = 0.0004), *P ≤ 0.05 (n = 5 females, P = 0.0126). (E) Immunohistochemical analysis of the aortic atherosclerotic lesion (females) at low magnification (40×). Tissue sections obtained from aortic atherosclerotic lesion were treated with normal rat IgG, rat anti–mouse F4/80 (macrophage), rat anti–mouse CD106 (VCAM-1) and rat anti–mouse CD3 (T cells).
Figure 3
Figure 3
Ablation of AEBP1 influence on lipid and energy metabolism in LDLR −/− mice. (A) Plasma cholesterol levels of AEBP1+/+/LDLR −/− and AEBP1−/−/LDLR −/− mice after 13 wks of atherogenic diet feeding. Error bars represent SEM, *P ≤ 0.05 (n = 4 males, P = 0.44; n = 5 females, P = 0.034). Plasma triglycerides levels of AEBP1+/+/LDLR −/− and AEBP1−/−/LDLR −/− mice after 13 wks of atherogenic diet feeding. Error bars represent SEM (n = 5 males, P = 0.26; n = 5 females, P = 0.28). (B) Measurement of body weight of AEBP1+/+/LDLR −/− and AEBP1−/−/LDLR −/− mice fed an atherogenic diet. Three-week-old mice were fed an atherogenic diet for 13 wks. Body weight was measured weekly. (C) Food intake was measured weekly and normalized to body weight. Total energy intake per group in a cage was calculated as the mean value per 100 g body weight. The data points represent the mean values of 13 weekly measurements of total energy intake. Error bars represent SEM, *P ≤ 0.05 (n = 5 males, P = 0.377; n = 5 females, P = 0.006). (D) Feed efficiency was calculated with the weekly measurements of mean values of weight gain and food consumption. The data points represent the mean values of 13 weekly measurements of feed efficiency. Error bars represent SEM, *P ≤ 0.05 (n = 5 males, P = 0.004; n = 5 females, P = 0.374).
Figure 4
Figure 4
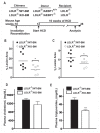
Atherogenesis is significantly attenuated in LDLR −/−/KO-BM mice compared with LDLR −/−/WT-BM mice. (A) Experimental design of generation of radiation chimera and list of chimeras. (B) En face analysis of aorta atherosclerotic lesion formation in LDLR −/−/WT-BM (n = 8) and LDLR −/−/KO-BM (n = 6) chimeras. Lipid staining was performed using the sudan IV reagent. Quantification of atherosclerotic lesion area was performed with ImageJ; the numbers represent atherosclerotic lesion as a percentage of total aorta area (*P = 0.0268). (C) Quantification of atherosclerotic lesions of aortic roots in LDLR −/−/ WT-BM (n = 8) and LDLR −/−/KO-BM (n = 6) chimeras. Atherosclerotic lesion size at the aortic sinus as a percentage of total aortic root area (*P = 0.05) is shown. (D) Plasma cholesterol levels of LDLR −/−/WT-BM (n = 8) and LDLR −/−/KO-BM (n = 6) chimeras after 16 wks of atherogenic diet feeding. Error bars represent SEM (P = 0.07). (E) Plasma triglycerides levels of LDLR −/−/WT-BM (n = 8) and LDLR −/−/KO-BM (n = 6) chimeras after 16 wks of atherogenic diet feeding. Error bars represent SEM (**P = 0.006).
Figure 5
Figure 5
Atherogenesis is significantly accelerated in ApoE −/−/TG-BM mice compared with ApoE −/−/NT-BM mice. (A) Experimental design of generation of radiation chimera and list of chimeras (n = 5) for each chimera. (B) En face analysis of aorta atherosclerotic lesion formation in ApoE −/−/NT-BM and ApoE −/−/TG-BM chimeras. Lipid staining was performed using sudan IV reagent. Quantification of atherosclerotic lesion area was performed with ImageJ; numbers represent the atherosclerotic lesion as a percentage of total aorta area (***P = 0.0001). (C) ORO staining of atherosclerotic lesions of aortic roots in ApoE −/−/NT-BM and ApoE −/−/TG-BM chimeras. Graphs showing quantification of atherosclerotic lesion size at the aortic sinus as a percentage of total aortic root area (***P = 0.0001). (D) Analysis of total plasma cholesterol and triglyceride levels in ApoE −/−/NT-BM and ApoE −/−/TG-BM chimeras.
Figure 6
Figure 6
PPARγ1 and LXRα expression and proinflammatory mediators are significantly up-regulated in ApoE −/−/TG-BM macrophages compared with ApoE −/−/NT-BM macrophages. (A) Relative protein levels of PPARγ1 and LXRα in macrophages from chimeras were analyzed by immunoblotting with specific antibodies. (B) Densitometric analysis on the basis of β-actin expression in macrophage from chimeras is shown. (C) Transcript levels of PPARγ1, ApoE, IL-6 and TNF-α were assessed by real-time PCR analysis. Statistical significance was determined relative to protein expression level or mRNA level in macrophages isolated from ApoE −/−/NT-BM mice (n = 5). Transcript levels of ABCA1 and ABCG1 were assessed by real-time PCR analysis in triplicate with pooled samples (n = 5). ***P < 0.001.

Similar articles

Cited by

References

    1. Ross R. Atherosclerosis: an inflammatory disease. N Engl J Med. 1999;340:115–26. - PubMed
    1. Libby P. Inflammation in atherosclerosis. Nature. 2002;420:868–74. - PubMed
    1. Ricote M, et al. Expression of the peroxi-some proliferator-activated receptor gamma (PPARgamma) in human atherosclerosis and regulation in macrophages by colony stimulating factors and oxidized low density lipoprotein. Proc Natl Acad Sci U S A. 1998;95:7614–9. - PMC - PubMed
    1. Tontonoz P, Nagy L, Alvarez JG, Thomazy VA, Evans RM. PPARgamma promotes monocyte/macrophage differentiation and uptake of oxidized LDL. Cell. 1998;93:241–52. - PubMed
    1. Nagy L, Tontonoz P, Alvarez JG, Chen H, Evans RM. Oxidized LDL regulates macrophage gene expression through ligand activation of PPARgamma. Cell. 1998;93:229–40. - PubMed

Publication types

MeSH terms